1 All Tests Viewer and Results Viewer
 |
431-955 February 2020 |
2 Introduction
VectorPro™, VectorPro™ MT and VectorPro™ Lite are all registered trademarks of Mecmesin Ltd.
VectorPro is a dedicated software solution used for the programming and acquisition of data from a range of Mecmesin test stands and instruments.
2.1 User Guidance
This user manual section covers the All Tests Viewer and Results Viewer only, for further guidance relating to other aspects of VectorPro please refer to one of the documents listed below.
2.1.1 VectorPro™ User Manuals
Click one of the links below to navigate to the applicable user manual.
 |
 |
 |
A detailed guide to designing a test for VectorPro MT compliant test systems. |
|
Covers designing a test for VectorPro Lite compliant test stands and devices |
 |
 |
All Tests Viewer and Results Viewer (Current Document) A guide explaining the functionality of the All Tests Viewer and Results Viewer. |
 |
 |
|
View the latest version of the Mecmesin VectorPro Software License Agreement. |
3 All Tests Viewer
![]()
The ‘All Tests’ viewer is made available to users by granting the corresponding permission. A user can view all tests, but will not be able to copy, edit or use them without the correct permissions.
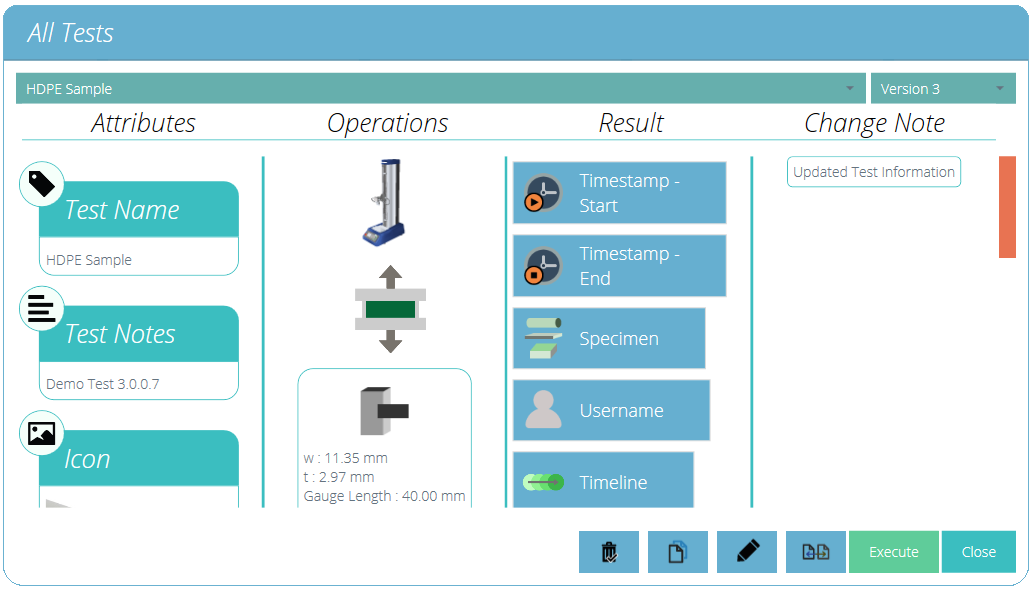
The drop-down lists at the top of the window displays all the tests available and all previous versions of the selected test.
Attributes, device identity (Image), system operations, result contents and change notes are all shown in the main section. This table enables quick reference to compare different tests or different test versions for example.
Change notes that were added when a new version of a specific test was saved, can also be viewed.
Depending on permissions given to the user the following actions can be performed:
| Compare test samples: This opens the comparison window that allows the user to compare samples from multiple tests. See section 'Compare a Test Sample' for more details. | |
| Edit current test: This action enables edit of the current test. Note certain actions will be greyed out if the test has been run before. See section 'Editing a Test' for more details. | |
| Copy a test: This duplicates the test at its current version number. The newly created test will revert to version 1. See section 'Copying a Test' for more details. | |
| Delete: This deletes ALL versions of the test including results files. | |
| Execute: This opens the selected version of the test file ready for data acquisition. |
3.1 Editing a Test
To edit an existing test simply click the tools icon located on the relevant test tile (circled below). This opens the tools menu pictured right, simply click the pencil icon located within. To edit a test, click the pencil icon at the bottom of the ‘All Tests’ viewer.
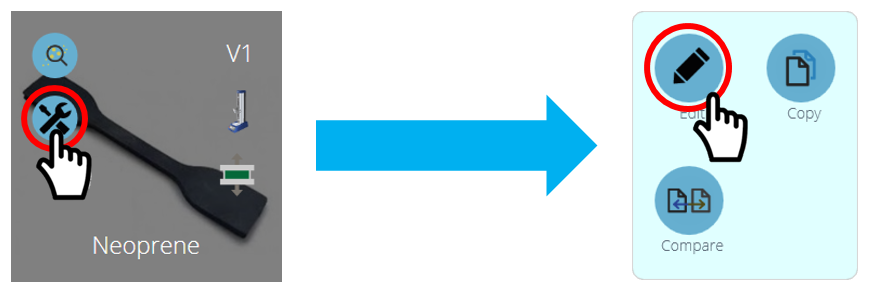
Pressing the edit button opens the test designer screen. Here the user can alter all details of the test selected. If the user has also been assigned ‘save’ permission in the test itself, they may change parameters and save a new version or override the existing version.
- When changes are complete, click the back symbol located at the top left of the screen and save the test.
- For more information regarding the saving of tests please see the 'Users and Permissions' section located in the Introduction and Initial Setup User Manual.
Calculations can also be edited from the ‘Results’ tab located within the ‘Test Designer’ screen and the ‘Results Viewer’. Here, a calculation adjustment may be made firstly, before creating new test versions.
3.2 Compare a Test Sample
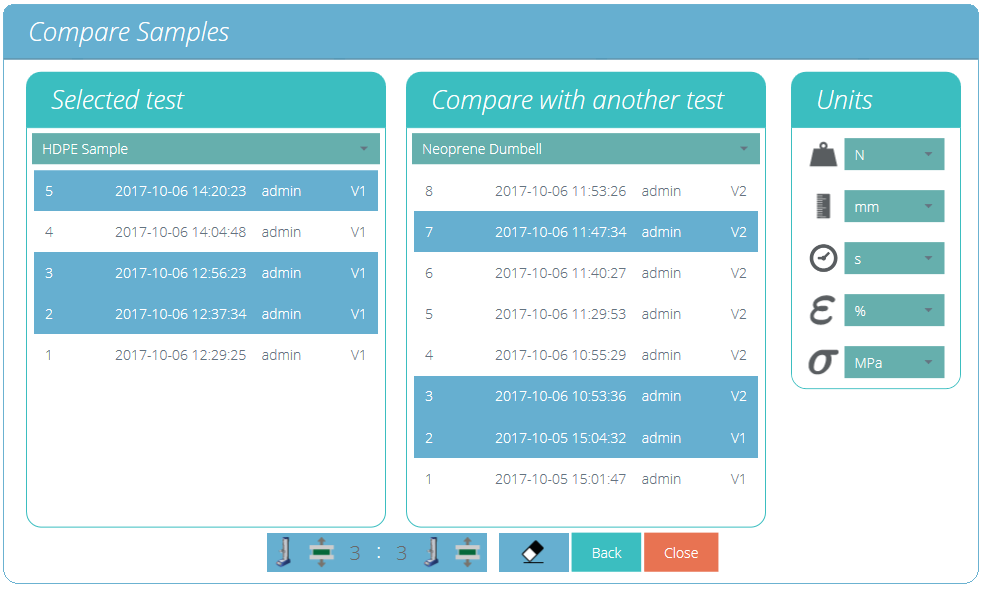
Compare samples screen.
To access the compare samples function, click the corresponding button which is located on each individual test tile within the tools menu. This is also available at the bottom of the ‘All Tests’ explorer view. Both icons are pictured below.
The ‘Compare Samples’ window allows the evaluation of results from different test files. Two tests can be selected and within each test, individual test files can be seen. The test result naming convention consists of:
- The test result title consisting of the date (YYYY-MM-DD) and time of day (HH:MM:SS),
- The user that ran the test,
- Test version used for that sample (e.g. V2 is version 2)
Test results are selected using the two drop-down menus located at the top of the window; to select the desired result files, simply click the files required. Selected files are highlighted in blue.
![]()
To clear any currently selected result files simply hit the eraser button located at the bottom of the screen, as shown in the image above.
On the right-hand panel, the selection of the global units for this test is available. This will ensure all displayed results are in the same base unit. Once the desired test results are selected, click the compare button, the results will then be displayed in both graphical (see section 'Results Viewer') and numerical form (see section 'Viewing Results: Calculations Display').
The report and results template used for comparing the samples is sourced from the primary selected test (The test from which the comparison button was pressed), this covers the export template and calculations. It is only possible to compare samples from the same hardware category, below is a table with the four main categories. The right-hand column shows the comparable instruments within that category.
|
Hardware Category |
Comparable Instruments |
|---|---|
|
Serial Force |
AFG, AFTI-Force, BFG, CFG+ |
|
Serial Torque |
AFTI-Torque, Orbis, Tornado |
|
Stand Force |
MultiTest-dV, MultiTest-dV(u) & OmniTest |
|
Stand Torque |
Vortex-dV |
Please Note: Users cannot run a test when comparing sample results.
3.3 Copying a Test
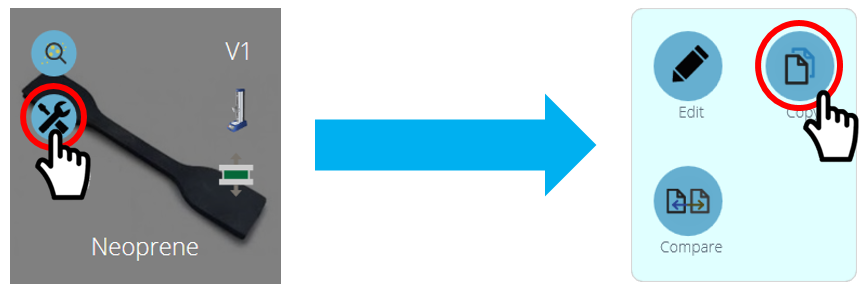
Copying a test can be achieved by clicking the ‘Copy’ test icon. This is located on each individual test tile as seen above or at the bottom of the ‘All Tests’ explorer window.
| Clicking the ‘Copy Test’ button located on the test tile will create a copy of the test at its latest version. | |
| Clicking the ‘Copy Test’ button located at the bottom of the ‘All Tests’ window will create a copy of the version currently selected. |
Please Note: Please be aware that test results are not duplicated, only the design of the test is copied.
Using the ‘Copy Test’ function allows a different machine type (to that assigned for the original test), to be used in the new test definition. This allows users with multiple machines to develop, run and share test definitions across their machine range.
Selecting either of the copy test buttons will present the user with the machine selection screen shown below.
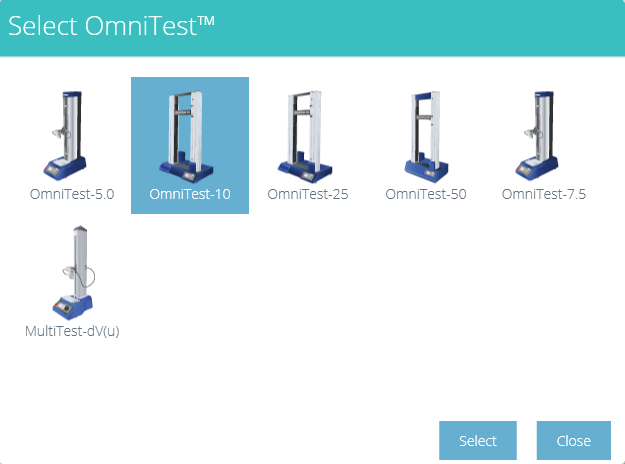
Highlight the machine model that is required for the new test definition to work with and then press the ‘Select’ button.
The newly created test method will then be opened to the Attributes screen and the user should type a new name for the test.
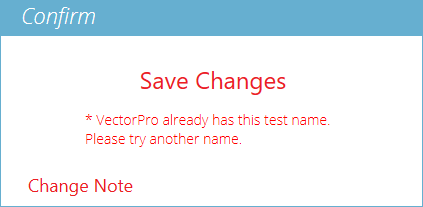
All tests within VectorPro must have a unique name.
4 Results Viewer
![]()
As with the ‘All Tests’ viewer, the ’Results’ viewer gives access to all tests that are available to a user. Click the grey ‘Results’ tile on the ‘Workspace’ to open the ‘Results’ viewer. This can also be accessed by clicking the results icon located on each individual test tile (circled above).
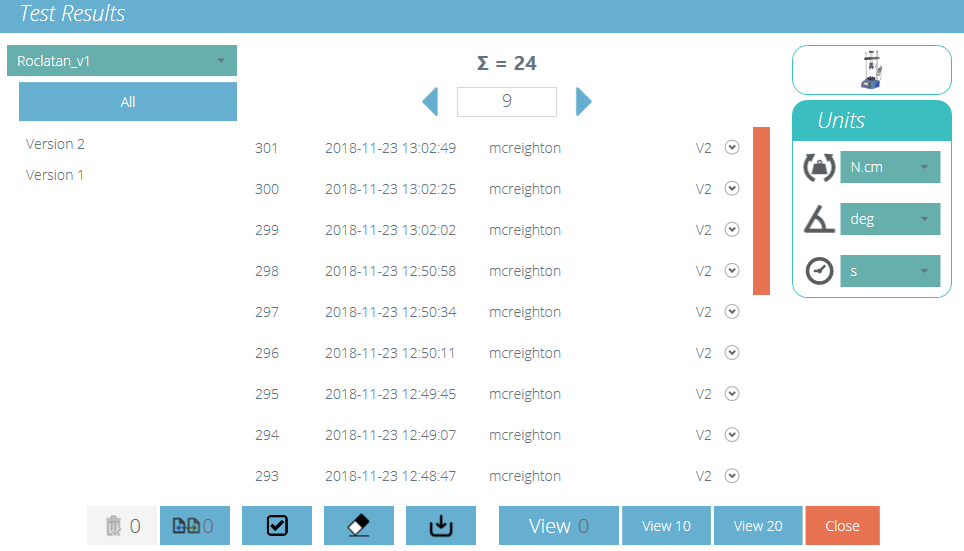
The main view results screen.
The results view shows 20 lines of result information per page with a scroll bar down the right-hand side to enable navigation.
At the top middle of the view is the result paging tool. This shows the total number (∑) of pages containing up to 20 results, with the current page displayed in the view window. Using the left and right arrows to scroll the pages.
The individual result units are selectable on the right-hand side. This allows the user to choose the dimensional unit shown for the graph axes and the result when viewed. These are temporary settings only which can be displayed or exported, but the original result units selected at test creation are stored as default.
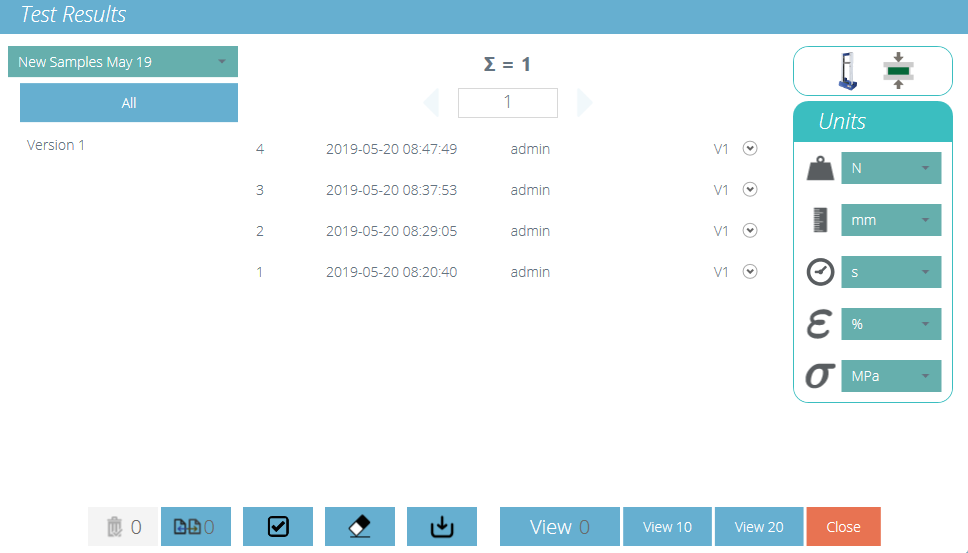
Here, four results from the test have been selected. The results display can be filtered their ‘Version’ number on the left-hand side of the screen. In the image above ‘All’ versions have been selected. To view the tests simply click ‘View’. Options to select ‘View 10’ and ‘View 20’ to open a predefined number of tests are available. When using the ‘Results’ viewer be aware that:
- If a version is not selected, any selected results will be viewed in the latest version, with its results and report profile. Later results cannot be viewed in an earlier version.
- To view results from a particular version of the test, select the test version on the left. Results from only this version are displayed, using the results and report profile from that version.
- To view all versions again, click ‘All’.
- Click on each individual result to view or compare. ‘View 10’ or ‘View 20’ selects the most recent results.
4.1 Viewing Results - Graph Display
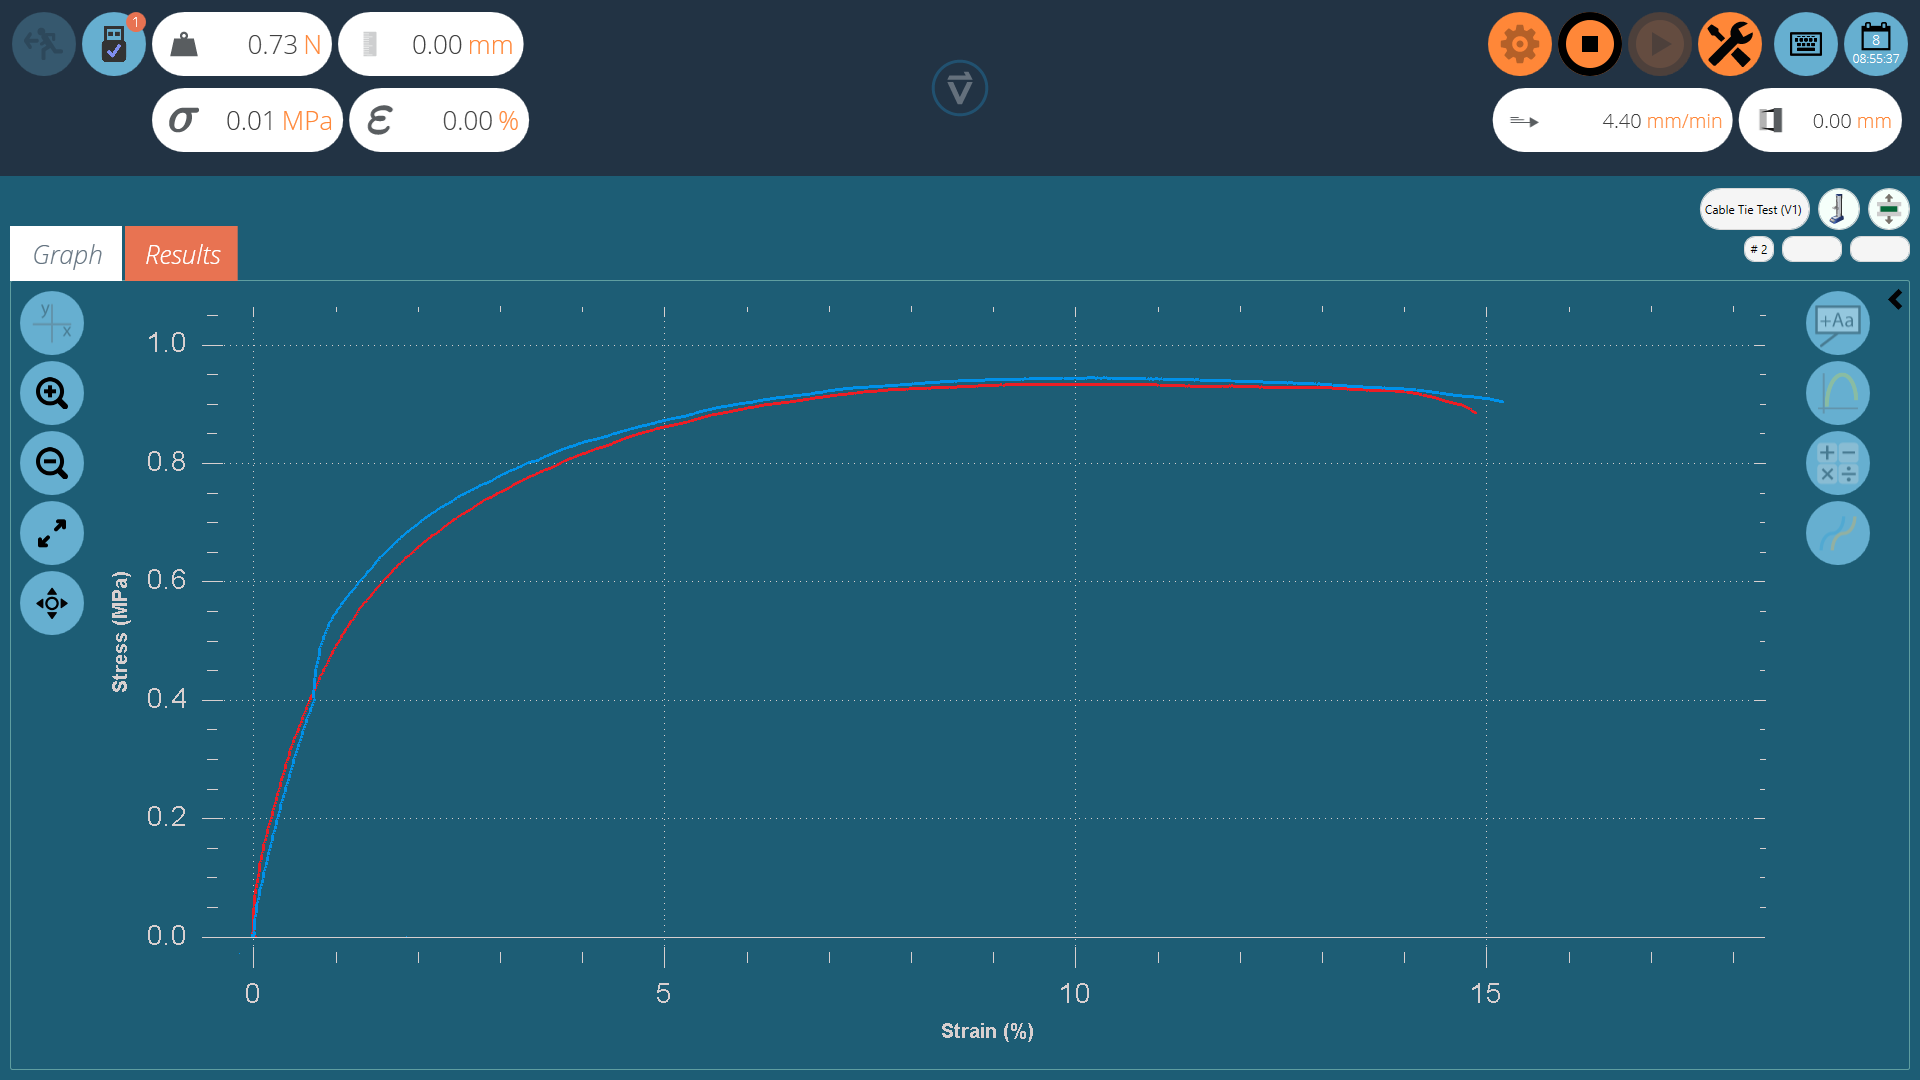
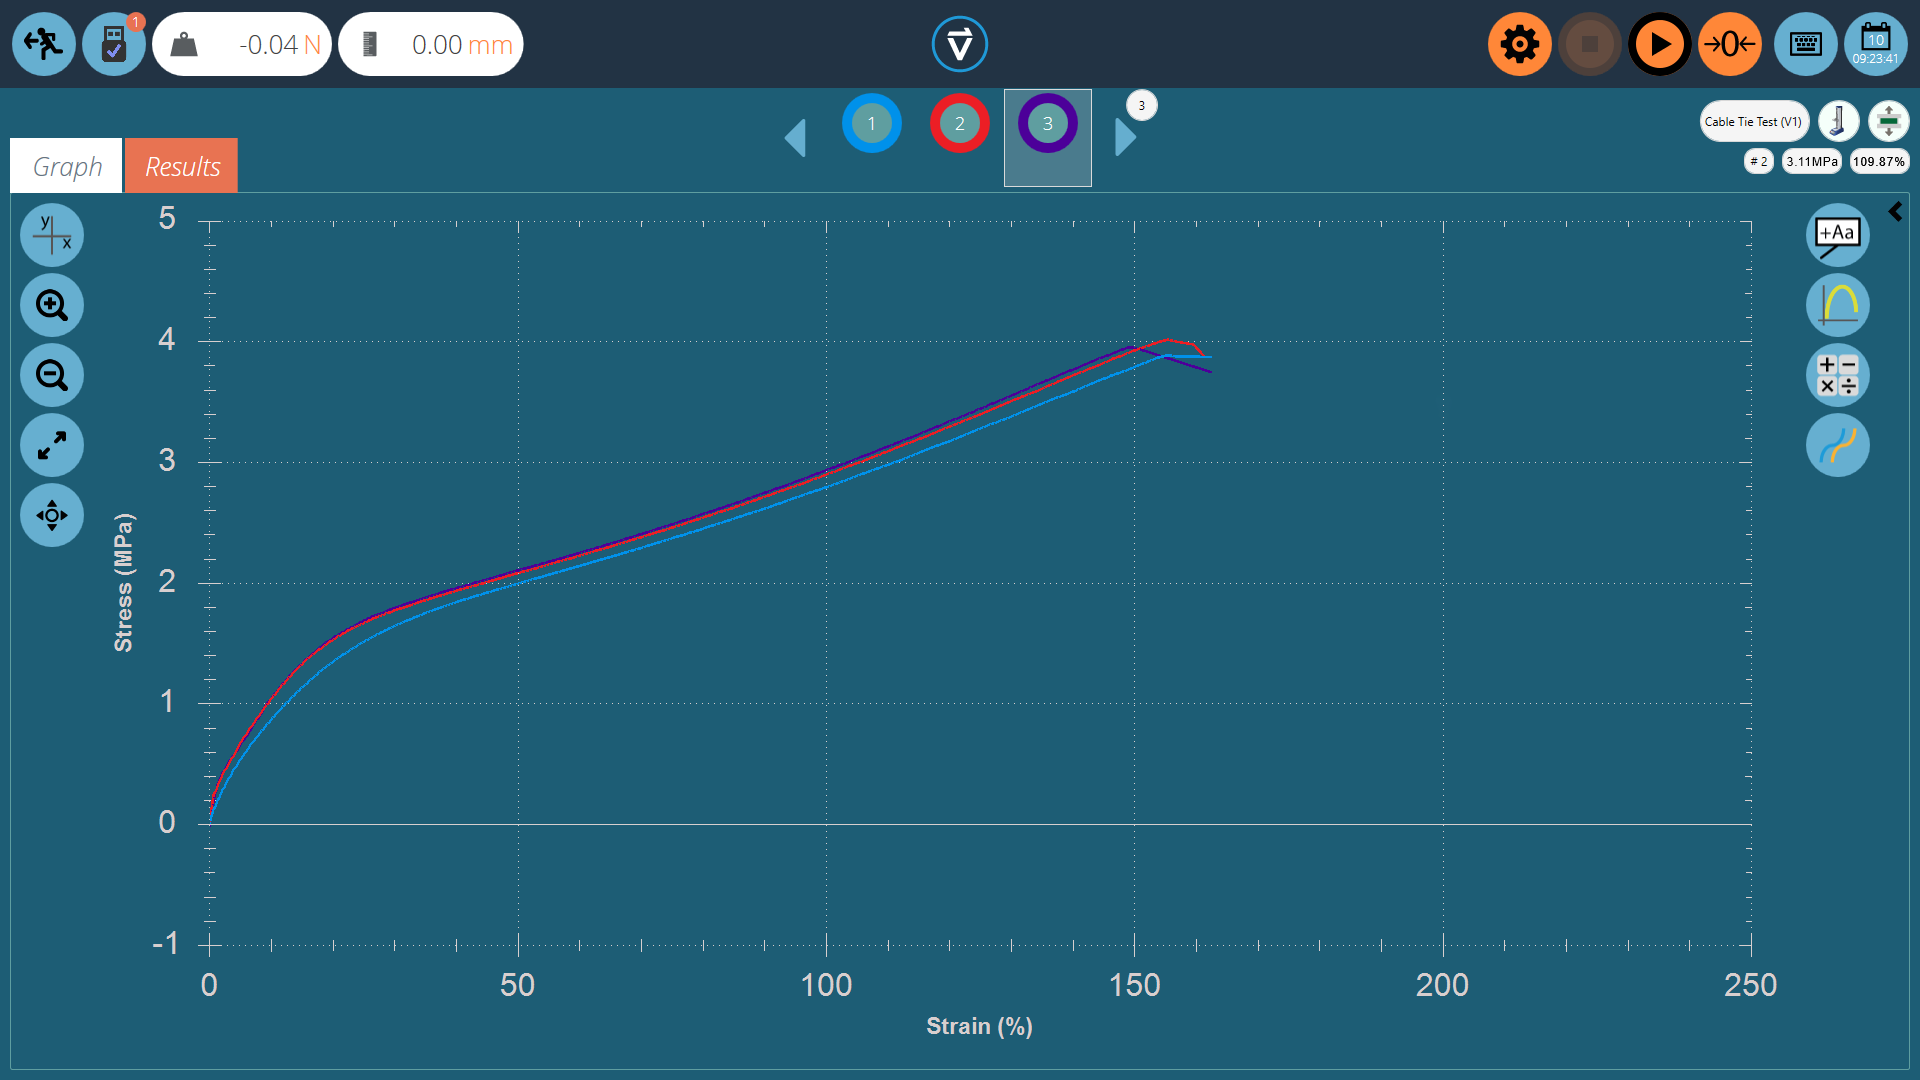
Upon clicking the ‘View’ button the samples selected are displayed in the ‘Results’ window. Immediately this loads into the graphical display and the user can see the results plotted.
Within this windows there are options to help analyse data to its fullest. These options and settings are covered in the sections below.
4.1.1 Formatting the Graph Display
The X/Y button on the left offers graph display controls. Select between displacement, load, stress and strain on the Y-axis and time, displacement, load and strain on the x-axis
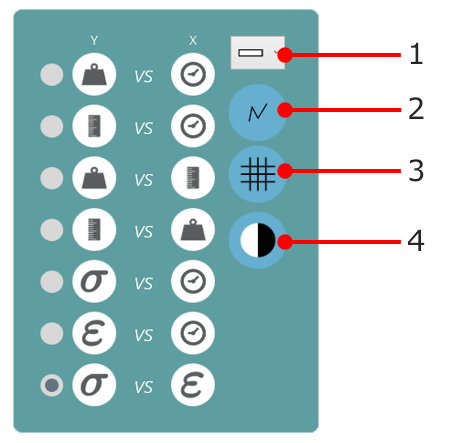
| 1 | Select the line thickness |
|---|---|
| 2 | Display the data points |
| 3 | Show or hide gridlines |
| 4 | Select the plot area background colour |
4.1.2 Sample Display
Each sample is represented at the top of the graph display in a row of coloured circles, between the two blue scroll arrows. Up to eight samples appear at a time in the sample selector bar. Click the blue arrows to move between samples or to scroll to more. The total number of samples in the current selection is shown in the top right-hand area of the screen, below the test name.
The numbers are assigned sequentially each time the test is run, and are sequential across all versions.
Click underneath a colour circle to select a sample, or inside the circle to change how the sample is viewed (its display properties). Samples can be:
Named – Hidden – Deleted – Offset - Assigned a different colour.
All these selections carry through to the graph display in reports.
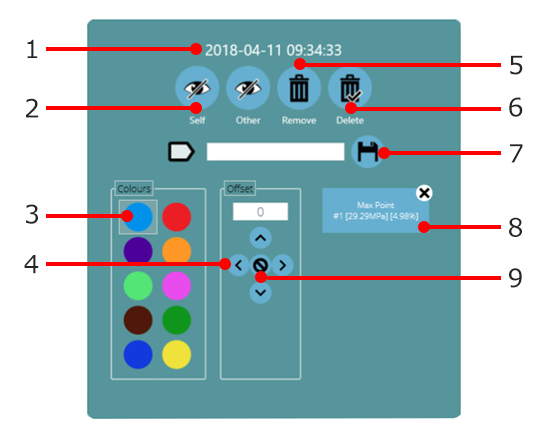
| 1 | Time and date at the point the samples test was completed |
|---|---|
| 2 | ‘Self’ hides the selected sample. ‘Other’ will hide all other samples |
| 3 | Select a different colour for this specimen. Others will not change |
| 4 | Offset this specimen’s graph trace by the amount entered, in any direction, for viewing clarity |
| 5 | Deselect this specimen from the current selection |
| 6 | Delete this specimen completely from the test record. This CANNOT be reversed! |
| 7 | Add a name to this specimen (click the save button to store the custom name) |
| 8 | View/delete annotations |
| 9 | Clear this specimen’s offset |
4.1.3 Header Bar
Within the results viewer, the header bar consists of three main areas, all of which provide specific functions to aid viewing of test results.
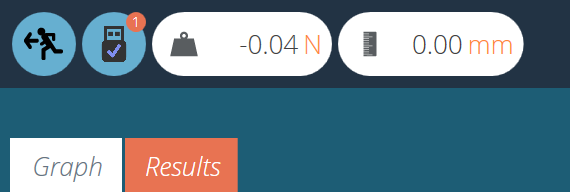 |
The upper left section contains the live readings, stand information (USB icon) and the tabs that enable switching between the graph and results screen. |
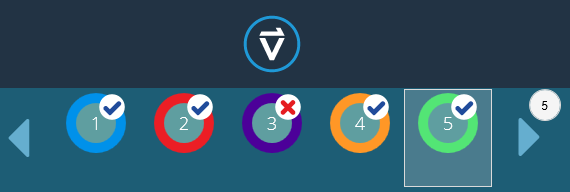 |
The centre of the header bar contains the VectorPro logo, which contains help features, system information and screen switching options. The lower section contains the sample icons (with a pass or fail denoted by a tick or cross) and scroll controls, with the number of test samples indicated in the sample above.
|
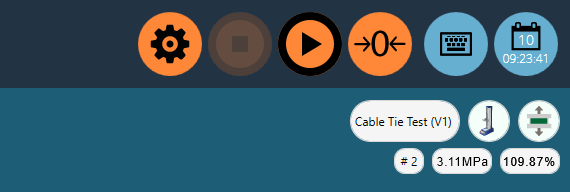 |
The upper right-hand section contains the on-screen keyboard button and calendar. The lower section contains test information such as the test name, test stand (graphic), test type (graphic), sample number selected and the X and Y position of the mouse on the graph in relation to the selected sample. |
4.1.4 Calculations and Results
Calculated results, as set within the test designer, are displayed in two main areas. To view all calculated results instead of the graph, click the ‘Results’ tab. Alternatively, calculated results can be viewed side by side with the graph, in a scrolling display, by clicking on the black arrow circles in the image below.
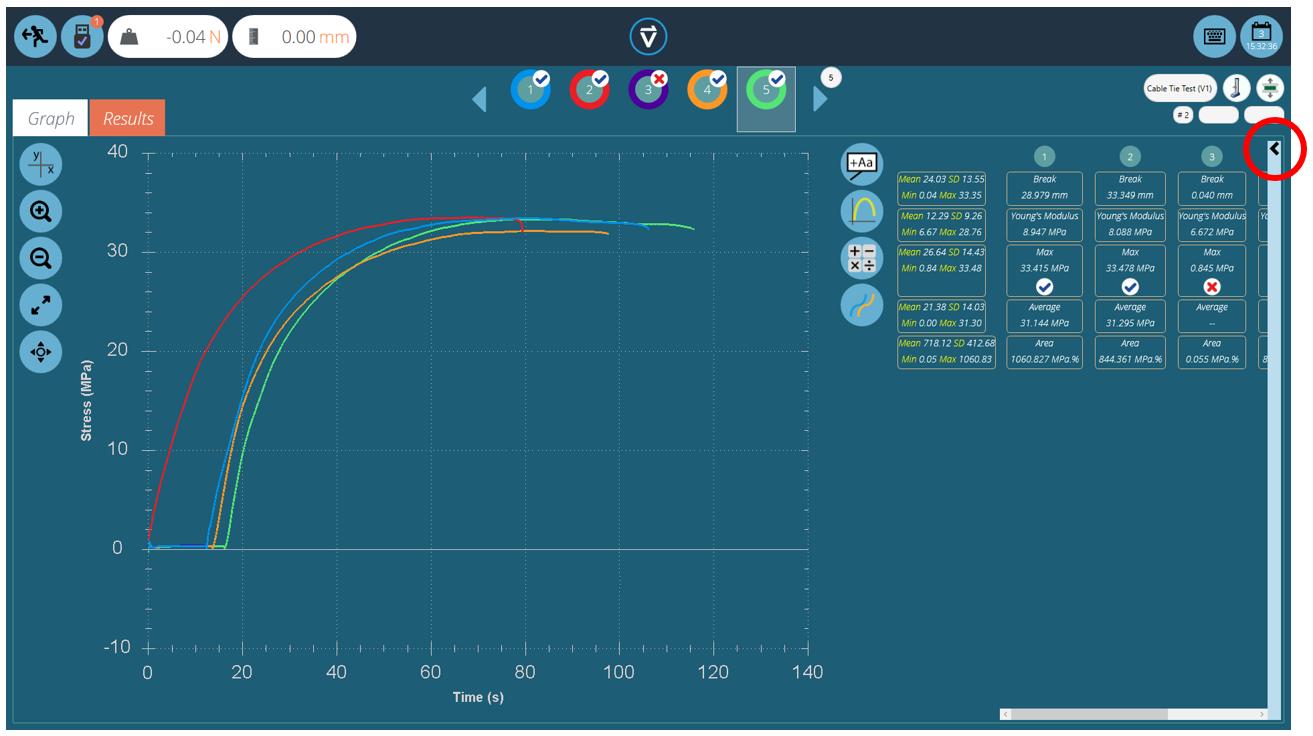
Additional spot calculations can be used by clicking the ‘Apply spot calculation’ icon. The selected calculation will apply to the currently selected sample and its current viewable X-Y range.
Other samples will be hidden from view until the calculation is cleared. Either a graphical interpretation (e.g. a best-fit line, or shaded area) and the result value will be displayed or a labelled data point (e.g. peak or max).
The right-hand settings bar features the following functions:
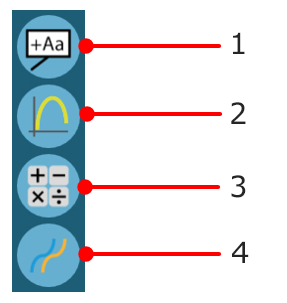
| 1 | Add annotations to the graph |
|---|---|
| 2 | Capture plot area |
| 3 | Apply spot calculation |
| 4 | Offset all the currently displayed specimens |
|
|
The upper ‘broom’ button clears any calculations. |
|
|
Calculations configured with verification options will display a ‘Tick’ or ‘Cross’ next to them for clear visual indication of whether that particular sample has passed or failed. |
4.1.5 Adding Annotations
| Annotations can be added to a sample trace to display data values and notes (up to 30 characters). These are not retained after closing but are captured in the image of the plot area (see ‘graph capture’ below). |
The ‘pop-up’ box is shown below:
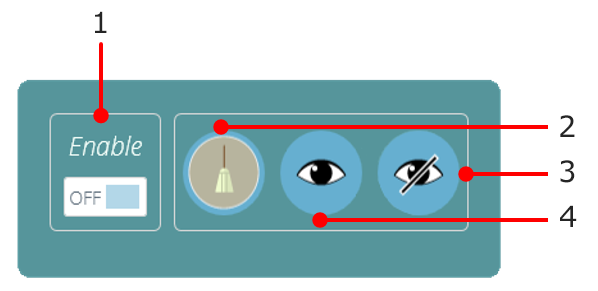
| 1 | Enable annotations |
|---|---|
| 2 | Clear all annotations |
| 3 | Hide all annotations |
| 4 | View all annotations |
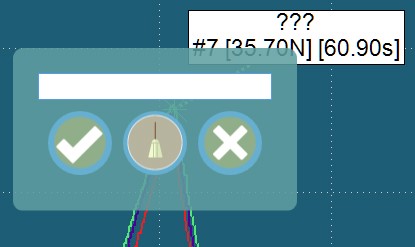
To annotate a sample, complete the following steps:
- Click on the data point to annotate (select a specific sample or samples first).
- Click on the plot area where the text should appear.
- Above the data point values, ‘???’ represents the label area.
- Add text and tick to save, cross to delete, or the broom to clear the text box.
To delete a single annotation click on the annotation icon and then click on the cross of the item to be deleted. To delete all annotations click on the broom icon.

4.1.6 Graph Capture
|
The plot area of the chart view can be captured: to print, copy, save as a graphics file (.emf. .png (default), .gif, .jpg, .tif, .bmp), or an email attachment (.png). To achieve this simply click ‘graph’ icon, pictured left. The options menu will then open as below: |
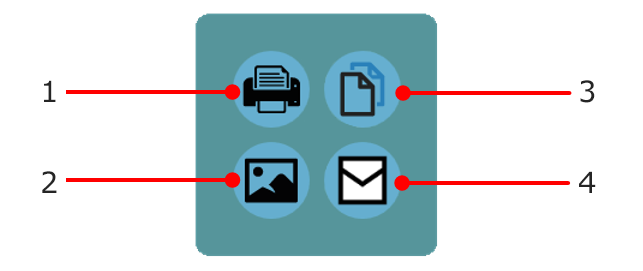
| 1 | Print the graph |
|---|---|
| 2 | Save the graph as an image |
| 3 | Copy the graph to the clipboard |
| 4 | Email the graph (Opens user default mailing system) |
4.1.7 Offsets
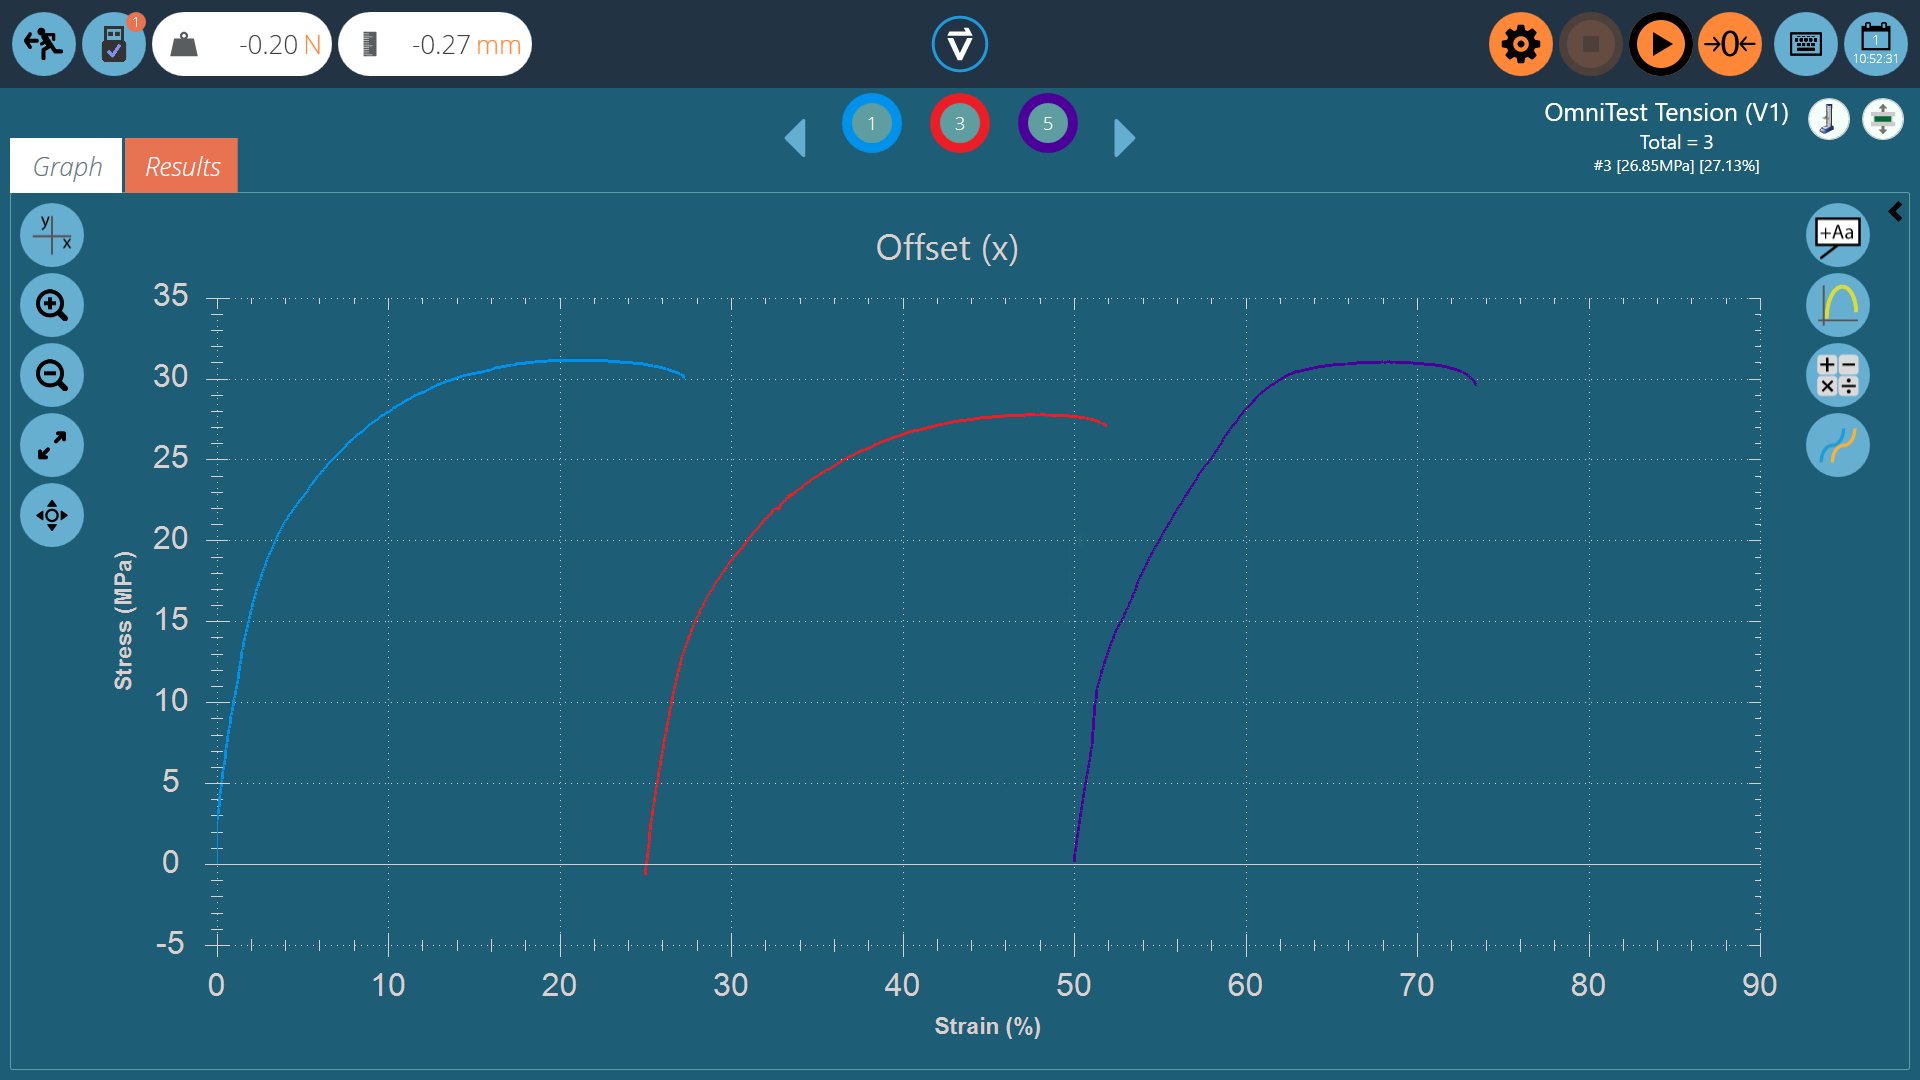
An individual sample can be offset using its display properties. An offset can also be applied to all samples, to spread them out for clarity, e.g. horizontally to compare strain, or vertically to compare characteristics along the stress axis. Click the offset button to view the options pop-up, pictured below:
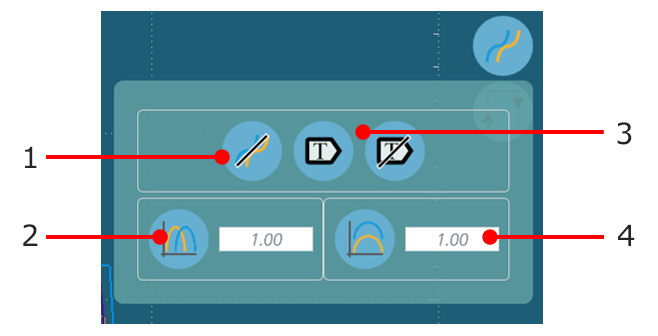
| 1 | Clear the display |
|---|---|
| 2 | Click to apply a horizontal offset |
| 3 | Toggle sample label display on and off |
| 4 | Vertical offset value |
Below is an example of three samples that have been offset for easy visual comparison.
4.1.8 Spot Calculations
 |
Spot calculations are used to quickly verify data or test future calculations while also enabling a visual display of the data on the graph display. To access spot calculations click on the spot calculation icon, pictured left. This will open the menu below: |
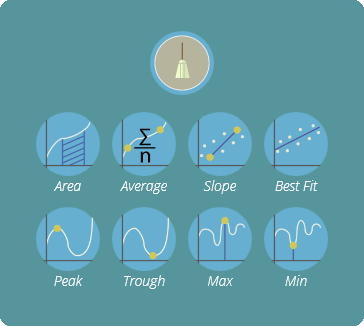
Within this menu there are two main functions; the broom icon, this deletes any currently applied calculation and the calculation section. Here the user can select the desired calculation to apply to the currently selected sample.
Below is an example graph showing the area under a curve for sample two:
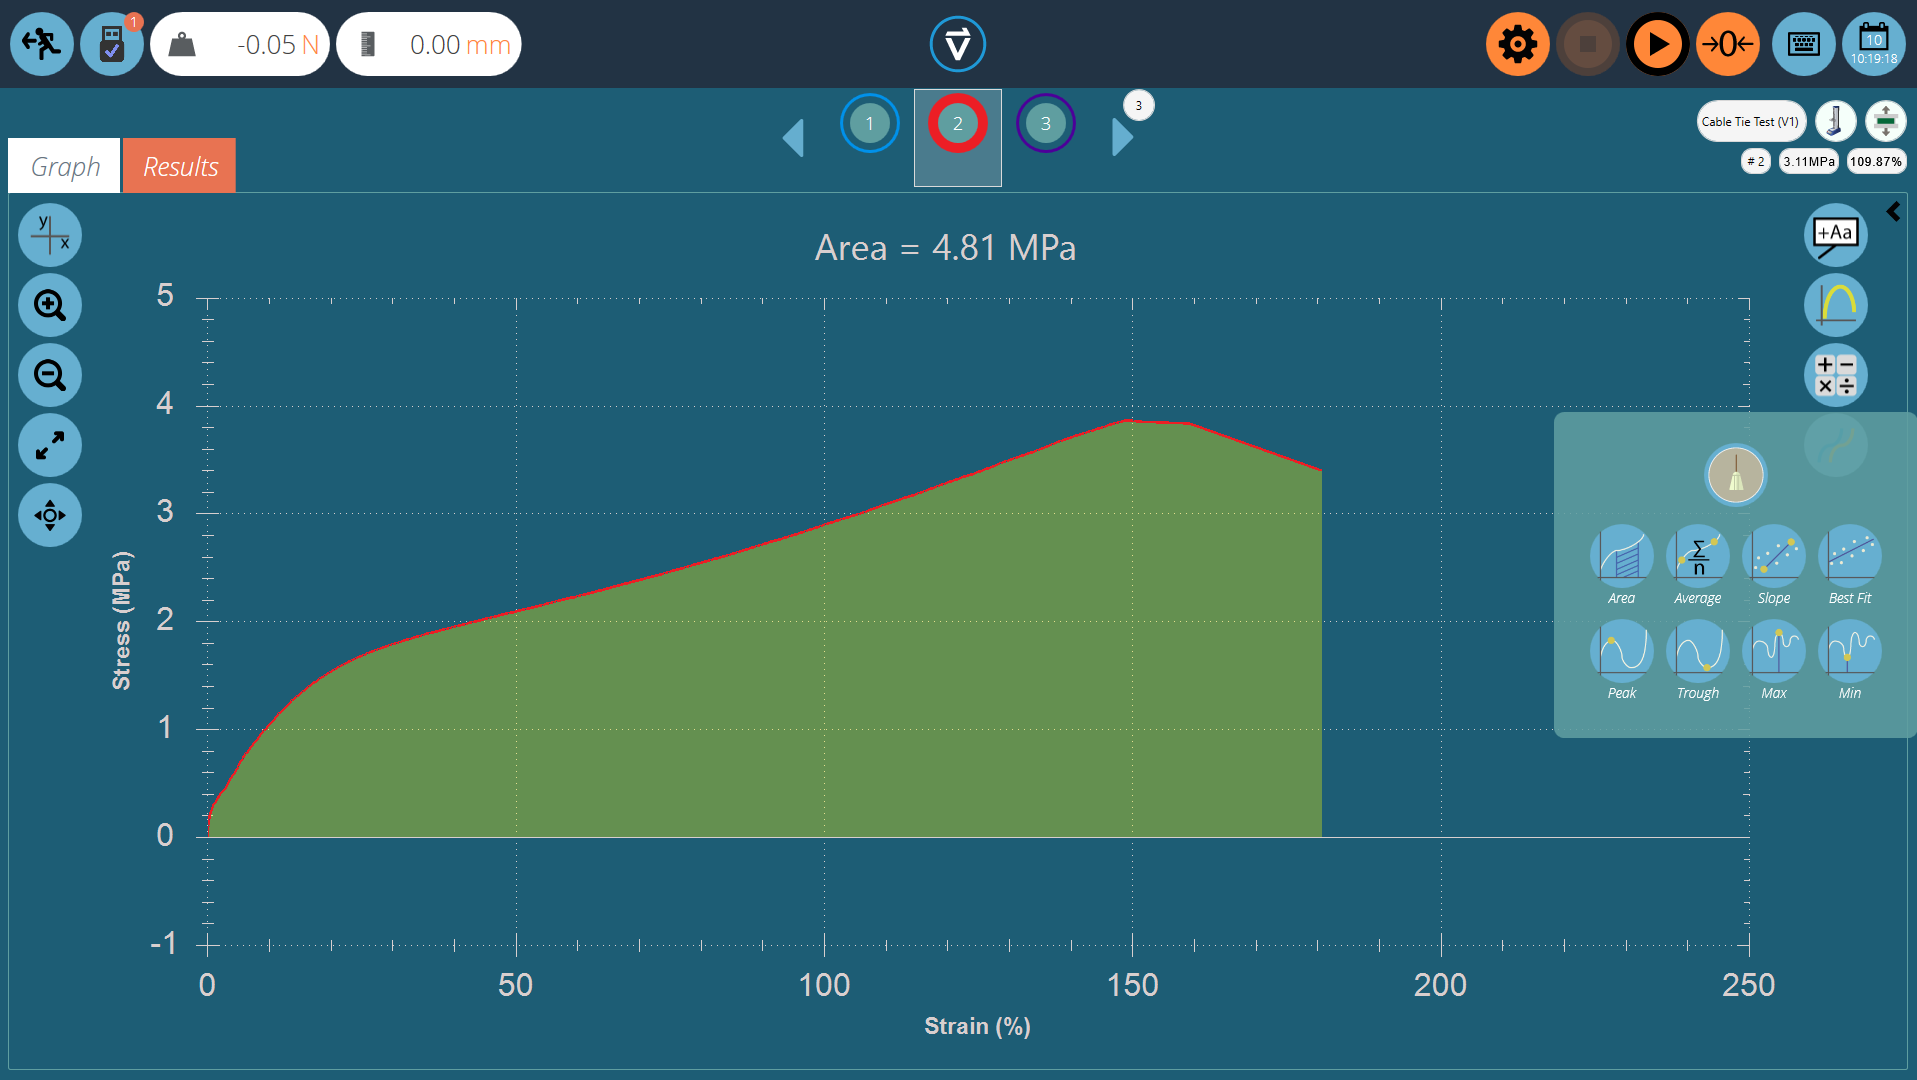
When selecting the calculation all other samples are hidden and a visual overlay is added to the display where the calculation is taking place. This can be saved for export using the graph capture buttons.
4.1.9 Setting Boundaries
For certain calculations, such as slope, it is important to set boundary conditions so the calculation is performed on the desired selection of data. For spot calculations, boundaries are set visually. Simply use the mouse (or pinch command if using a touch screen) to zoom to a specific area of the graph, VectorPro will display a box showing the area currently selected. This is pictured in the image below.
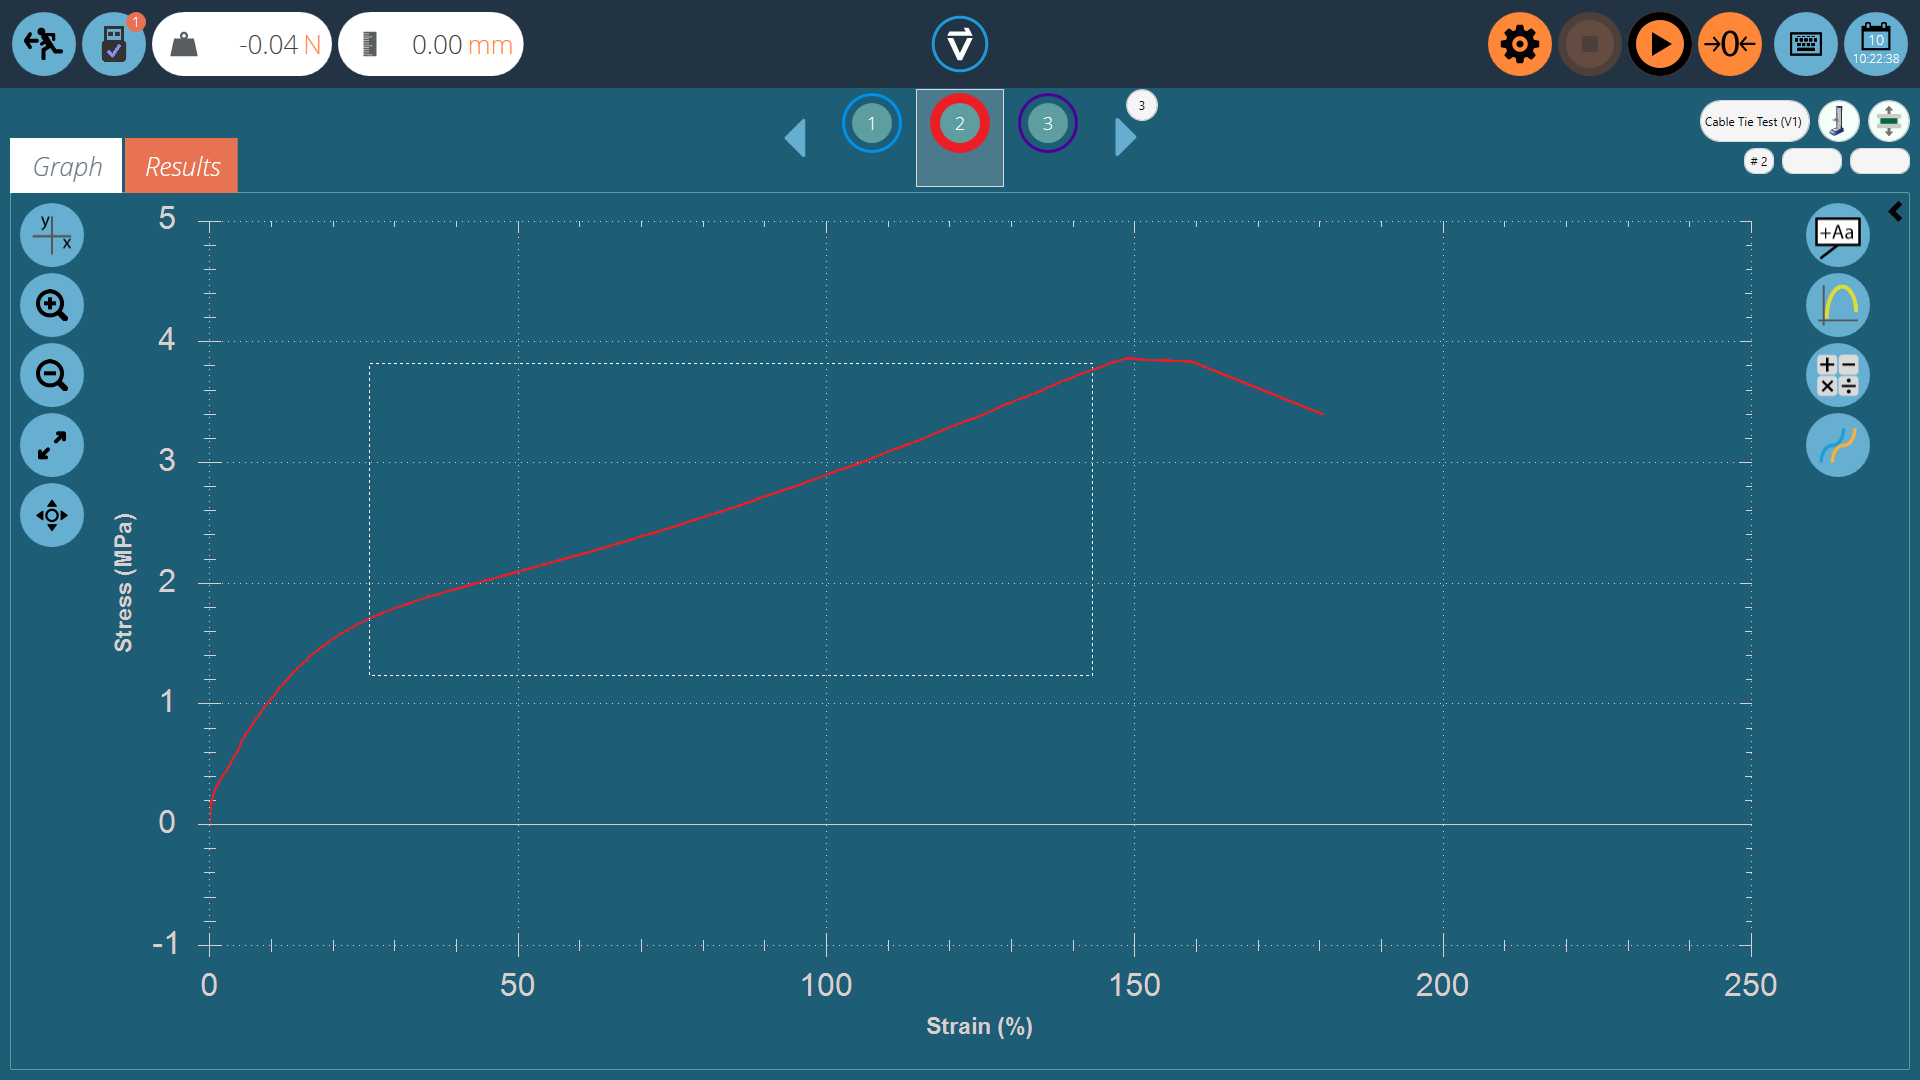
This will ‘crop’ the graph to the desired selection, then select the desired calculation, like in the image below.
Upon clicking on the desired calculation the graph will be loaded complete with the visual reputation of the calculation. This can be seen on the next page.
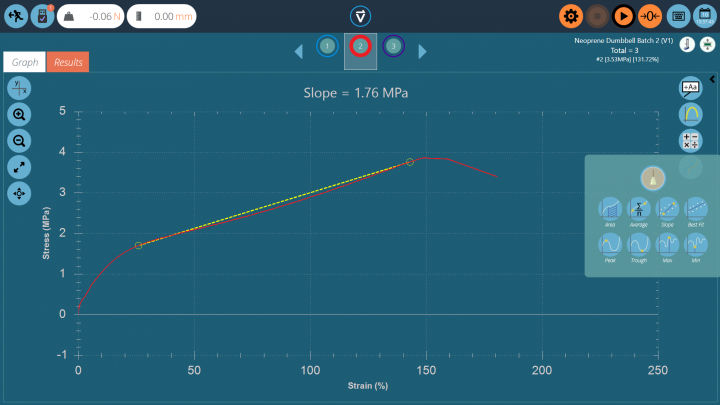
The calculation has now been set with boundaries based on the zoom window previously set.
Once again this can be captured using the graph capture settings and removed by using the ‘broom’ icon located in the spot calculations menu.
4.1.10 Zoom and Examine
Graph characteristics and data points can be examined more closely by zooming in. These are the controls available within VectorPro:
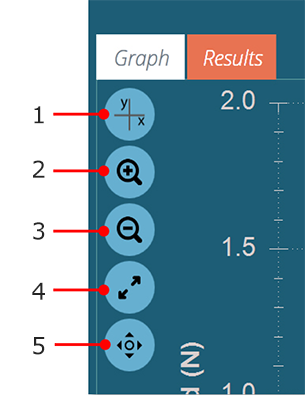
| 1 | Change axis |
|---|---|
| 2 | Click to zoom in progressively |
| 3 | Click to zoom out progressively |
| 4 | Click to restore the graph view (auto scale) |
| 5 | Click to switch drag action between select (marquee) and pan (arrows turn yellow) |
As well as the on-screen controls, graph manipulation is possible by using the computer’s mouse or touch-screen (zooming only). The supported controls are:
- Use the mouse scroll wheel to zoom in or out, this can also be achieved on touch screens by using a pinching motion,
- Hold the left mouse button and drag to crop the graph to a selected area,
- While holding the CTRL key, left click with the mouse or pointer and drag to pan across the graph area.
Whenever the cursor is over a sample trace, the data values of its position are shown at the top right of the graph view. See section 'Header Bar' for more information.
5 Viewing Results: Calculations Display
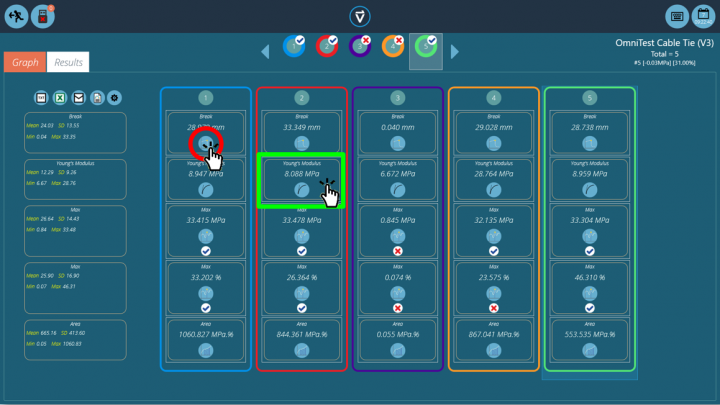
Click the ‘Results’ tab to see the calculated results screen. In this example, five results are shown where a ‘Max’ stress and strain calculations have been set up with verification limits. Three samples pass within the max strain limits and two fail (Sample 3 and 4). At the top, the sample selector bar shows that there were two fails overall, as sample four failed on the verification limit for the maximum strain. For more information, see the 'Verification of Calculations' section of either the Designing a Test MT Version User Manual or Designing a Test Lite Version User Manual, depending on your test system.
The sample selector provides the same functionality as used on the graph display screen.
- To edit or adjust a calculation, click on any individual result square (See green box within the image above). This allows the user to edit the calculation ‘On the fly’. Note: This will not be saved unless ‘Save’ on exit is used. Any calculations that have been adjusted will be marked with an orange ‘*’ until the test is saved.
- To view the graph of an individual calculation applied to a specific sample, click the calculation picture icon. See the red circle in the picture above.
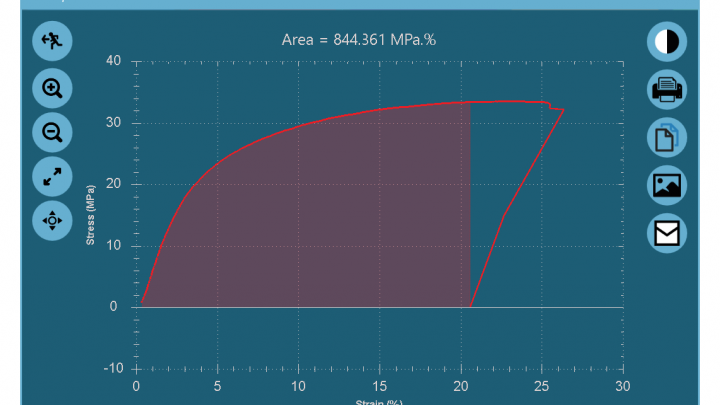
Graph of an individual calculation, opened by clicking the calculation icon for the desired sample.
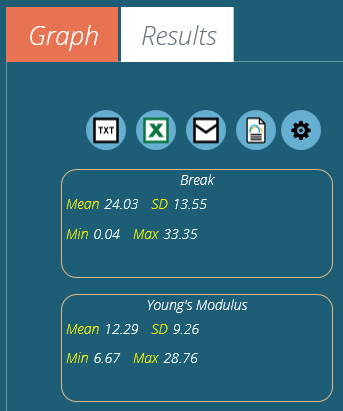
The left-hand column shows basic statistical results for all test samples. This shows:
- Mean value,
- Standard Deviation*,
- Minimum and maximum values across the sample range,
* Standard Deviation (SD) is a sample, not population SD (Variance calculated by dividing by N – 1).
5.0.1 Exporting Data and Results
Calculated results and raw data (all data points) can be exported to specific files or printed to reports, using the control bar located at the top left of the screen. The buttons on the control bar perform the following tasks:
| 1 | TXT Export (tab or comma delimited) |
|---|---|
| 2 | Excel Report |
| 3 | Email Results |
| 4 | Print PDF |
| 5 | Export Settings |
For an explanation of these functions, see the VectorPro - Running a Test, Reporting and Exporting User Manual.
6 Further Information
For more information relating to VectorPro, please return to the User Guidance section of this user manual and continue to the next applicable user manual.
