1 Overview
Welcome to your new touchscreen instrument from Mecmesin. It has been developed using our Vector OS technology platform. For ease of understanding in this operating manual, all touchscreen products will be referred to as "Vector Instruments".
Marking a new era for handheld force and torque gauges, Vector Instruments utilise a 5" colour touchscreen featuring 10-point multi-touch inputs. This intuitive touch interface supports familiar gestures, including 'swipe' navigation, 'press-and-hold', and 'pinch/expand-to-zoom'.
Vector Instruments have an integrated microSD card expansion port, supporting compatible memory cards up to 32GB, for storing your important test measurement data and subsequent easy transfer of data to a device of your choice.
Some functionality described here may not be available on your instrument. Please see the release change logs at the end of this manual. Your device is upgradeable and so by upgrading to the latest release you are ensured the best possible user experience.
1.1 User Manual icons and conventions
This document uses the following icons and style conventions for consistency.
1.1.1 Caution
1.1.2 Information
The information icon indicates additional or supplementary information about the action, activity or application.
1.1.3 Warning
1.1.4 Important terms
Bold text is used to refer to:
- icon meanings
- user interface elements—names of functional pages/screens
- instrument modes
- 1 Overview
- 1.1 User Manual icons and conventions
- 1.2 Vector OS software and updates
- 1.3 How sensitive is the touchscreen?
- 1.4 How durable is the touchscreen?
- 1.5 If your Vector Instrument becomes unresponsive
- 1.6 MicroSD storage
- 1.7 About lithium-ion batteries
- 1.8 Charging the battery
- 1.8.1 The first few times you charge your Vector Instrument - Learning mode
- 1.8.2 "My battery does not appear to charge"
- 1.8.3 "When I plug in my Instrument to a charger or my PC I see a popup with a big red flash on it"
- 1.8.4 "My battery has been charging for several hours but the charge level is showing <100%"
- 1.8.5 "Can I charge my Vector Instrument from a computer's USB port?"
- 1.8.6 "Can I charge my Vector Instrument using a power bank?"
- 2 Software updates
- 3 Out of the box (Factory default settings)
- 4 Use of peripherals
- 5 External Inputs EXT1 and EXT 2 (VFG/VFTI only)
- 6 Touchscreen interface and features
- 6.1 Swipe navigation
- 6.2 Vector OS icons
- 6.3 Numerical input wheel
- 6.4 Scroll bars
- 6.5 Multi-coloured LED
- 6.6 Dual-zone instrument display
- 6.7 Information bar
- 6.8 Entering and exiting menus
- 6.9 Primary sensor display
- 6.10 Secondary Display
- 6.11 Main button bar
- 6.12 Screen lock
- 6.13 Status bar
- 6.14 MicroSD card toolbar
- 6.15 Large format graph
- 6.16 AFG emulation
- 7 Device settings
- 7.1 Date and time
- 7.2 Units of measurement
- 7.3 Display
- 7.4 Sensor settings
- 7.5 Break Detection - how it works
- 7.6 Alarm settings
- 7.7 Printer settings
- 7.8 Serial COM Port 1 (EXT1) settings
- 7.9 Serial COM Port 2 (EXT2) settings
- 7.10 Statistics settings
- 7.11 Footswitch settings (VTG Tornado only)
- 7.12 Save configuration
- 7.13 Load Configuration settings
- 7.14 Device Management settings
- 7.15 Security settings
- 8 How-to guides
- 8.1 Power ON / OFF
- 8.2 Check charge status while charging
- 8.3 Reset to Factory Settings
- 8.4 Show instrument information
- 8.5 Show sensor information
- 8.6 Show microSD Card Information
- 8.7 Store Device Diagnostic information to the microSD card
- 8.8 Freeze (Pause) the Display
- 8.9 Transmit or Print a single Maximum value only
- 8.10 Select Operating Mode
- 8.11 Apply a multiplication factor
- 8.12 Perform Tests when used with a MultiTest-dV or Vortex-dV
- 8.13 Adjustment and calibration
- 8.14 Set date and time
- 8.15 Configure the Main Functions Bar
- 8.16 Make and record a measurement
- 8.17 Recall the last recorded test/measurement
- 8.18 Recall all stored (microSD card) tests/measurements
- 8.19 Export Data
- 8.20 Perform a series of measurements to obtain a statistical set
- 8.21 Using your VFG as a Shotcrete Penetrometer
- 8.22 Inserting and removing a microSD card
- 9 Firmware release history
1.2 Vector OS software and updates
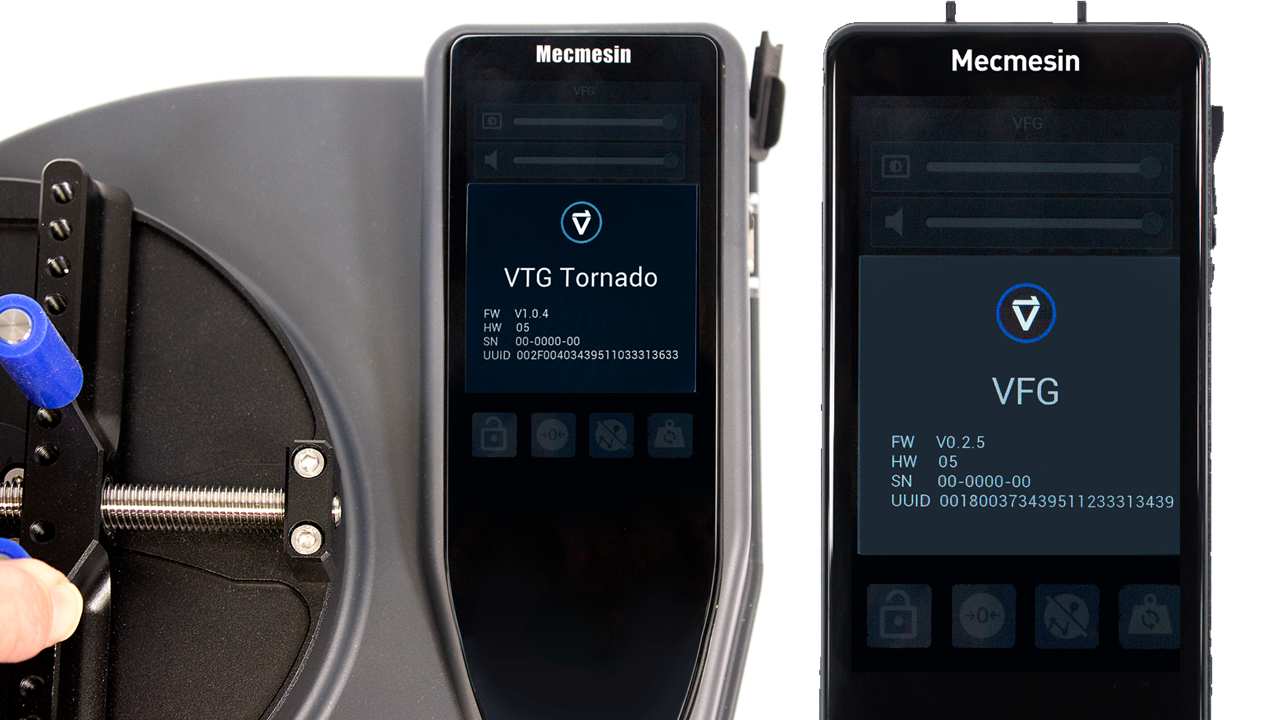
Vector Instruments (including the VFG, VFTI and VTG Tornado) are powered by Mecmesin's technology platform called Vector OS.
Your instrument is upgradeable (within the constraints of the installed hardware) and regular Vector OS updates will be issued for downloading to your device. Vector OS is in continuous development and open to feature requests—please contact us if there is a feature or function that would make the instrument(s) more effective for you.
1.2.1 Vector Instrument Programmer
See the Mecmesin website to download the Vector Instrument Programmer web app. With this and a Vector Cloud Solutions (VCS) account, you can access the latest firmware for all of your Mecmesin Vector devices including
- Vector Instruments
- MultiTest-dV
- OmniTest
Please refer to our Vector Instrument Programmer (VIP) - User Guide for step-by-step instructions on how to update your Vector instrument.
1.3 How sensitive is the touchscreen?
To avoid accidental activation the touchscreen has a built-in delay of a fraction of a second. In the case of the screen lock function, it has a longer delay of 0.5 seconds.
1.4 How durable is the touchscreen?
Vector Instruments are built for tough environments to deliver accuracy and reliability. The touchscreen is toughened glass designed to resist scratches, low-height falls, and blunt impacts.
Video: Vector Instruments - Touchscreen scratch and drop testing
1.5 If your Vector Instrument becomes unresponsive
In the unlikely event that your Vector Instrument becomes unresponsive, please contact your local representative or Mecmesin Technical Support (support@mecmesin.com).
1.6 MicroSD storage
Your Vector Instrument supports microSD cards up to 32 GB. Unformatted cards will be automatically formatted. MicroSD cards of a higher capacity will not be recognised by the instrument.
1.7 About lithium-ion batteries
Your Vector Instrument uses lithium-ion batteries as its power source. These are commonly used in many devices around the world but there are rules about how to transport them or dispose of them. Please check with your local representative before disposing of the Vector Instrument or its battery.
When returning your Vector Instrument to Mecmesin please follow the guidelines for your territory. Packages containing Vector Instruments must be labelled appropriately. Your territory may have specific requirements when it comes to domestic and international shipping of devices containing lithium-ion batteries. It is important that you familiarise yourself with these requirements before shipping any Vector Instruments to customers, or back to Mecmesin for repair/service/calibration.
If your Vector Instrument needs to be returned to Mecmesin for repair, you must identify if the battery is damaged or faulty. If your battery shows signs of swelling, burn marks or cracking do not send it by air, and contact your local representative.
If a Vector Instrument becomes faulty and needs to be returned to Mecmesin for repair then it is vital—before shipping it back—that it is established whether or not a faulty battery is responsible for the failure of the device. If it is suspected that the battery is faulty then it must be removed from the device and disposed of locally. Contact your local representative for advice.
1.8 Charging the battery
Vector Instruments are supplied with a partial charge in the Lithium-Ion battery. We recommend fully charging the battery of your device before use.
Mecmesin recommends a 'fast charge' USB-C charger (such as the one provided) be plugged into mains power and be used to charge Vector Instruments for maximum efficiency.
Other chargers may be used, but we cannot guarantee the rate of charge achieved in these circumstances.
Portable power banks can also be used to charge/extend the battery life of the device in situations where you may need to use Vector Instruments in remote areas.
1.8.1 The first few times you charge your Vector Instrument - Learning mode
In order to provide accurate battery charge levels, your Vector Instrument needs to 'learn' the battery behaviour. It does this during the first few charge cycles and during this time, the battery icon is shown as amber. During this time you see some unusual battery level display behaviour such as jumping from 90% to 99% or remaining at 99% for a long time. This is normal. If the behaviour persists for more than 5-10 charge cycles then please contact support@mecmesin.com.
1.8.2 "My battery does not appear to charge"
Sometimes, if a battery becomes depleted it can read 0% even when charging—this can go on for up to 30 minutes before a charge is registered on the instrument.
1.8.3 "When I plug in my Instrument to a charger or my PC I see a popup with a big red flash on it"
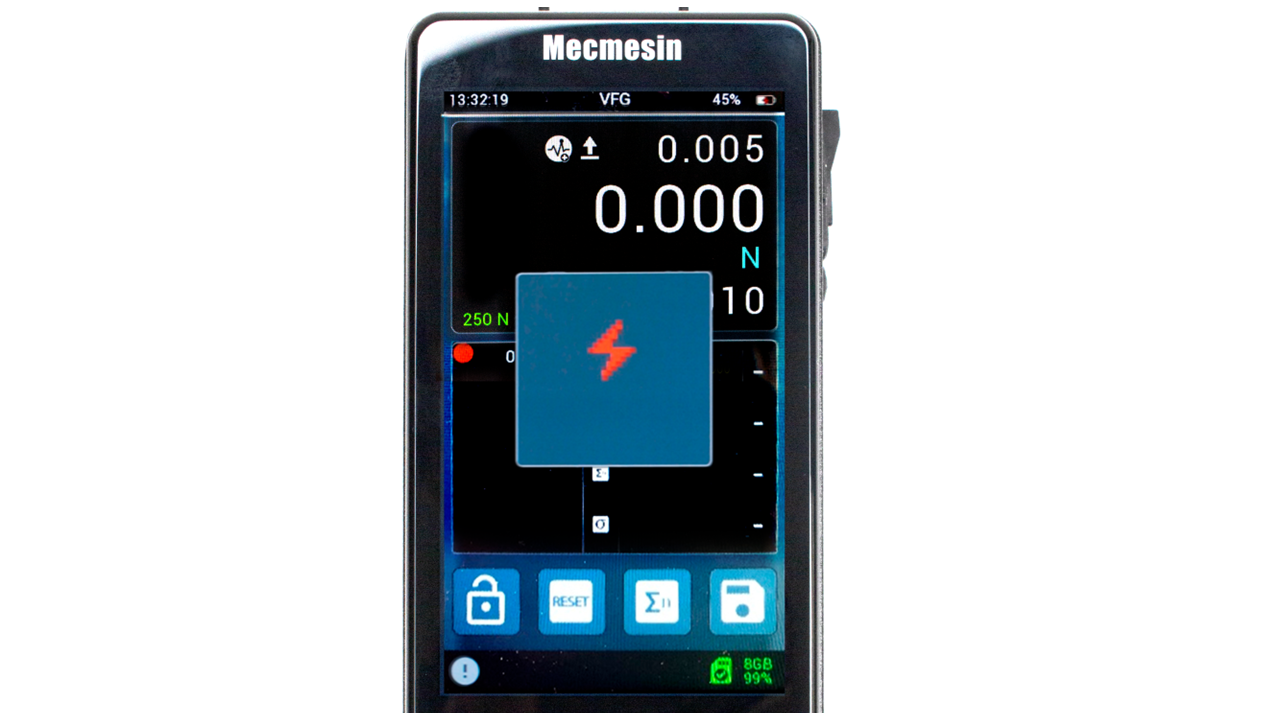
Your Vector Instrument uses a relatively high power battery. This means that it needs a high power charger to provide the instrument with a net popsitive charge. If the power supply you plug into is not designated "PD" then the instrument will show you the popup to tell you that there is not enough power in the supply to charge your device. Just touch the popup to clear it.
1.8.4 "My battery has been charging for several hours but the charge level is showing <100%"
There are two possible reasons for this: Some early instruments had an issue where the battery, even though fully charged, would not show 100% on the instrument - usually the charge value would stop at around 87% or 93%. To resolve this, update your firmware to the latest release (see Software Updates). In later versions, we implemented a learning algorithm that analyses the battery during the first few charge cycles. While this ultimately results in a more accurate battery charge level, during the learning stage the charge level can seem to be at 99% for a long time, and during discharge can seem a bit erratic. This needs no intervention and will settle down as the learning stage progresses.
1.8.5 "Can I charge my Vector Instrument from a computer's USB port?"
Connected to a computer USB port the instrument's battery will be trickle charged. However, the power output of a computer USB port is too low to provide a 'net positive' charge to the instrument's battery whilst the instrument is being used, but it will partially extend the battery life.
1.8.6 "Can I charge my Vector Instrument using a power bank?"
Portable power banks can be used to charge/extend the battery life of the device in remote areas. Performance will depend on the power bank used.
2 Software updates
Vector Instruments (including the VFG, VFTI and VTG Tornado) are powered by our technology platform, Vector OS. At the time of writing, the production version was 1.0.8.0
Your instrument is supplied with the latest version of Vector OS software pre-installed, so will not require updating until a new version becomes available.
Your instrument is upgradeable (within the constraints of the installed hardware) and regular Vector OS updates will be issued for downloading to your device. Vector OS is in continuous development and open to feature requests—please contact us if there is a feature or function that would make the instrument(s) more effective for you. Delivery of feature requests will depend on the workload and priorities of the development team.
2.1 Vector Instrument Programmer (VIP)
The Vector Instrument Porgrammer (VIP) is a software tool created to enable remote updating of Mecmesin products powered by Vector technology.
Please refer to our Vector Instrument Programmer (VIP) - User Guide for step-by-step instructions on how to update your Vector instrument.
Software updates and instructions on how to upgrade or update your instrument will be published when updates are released in the software section of our support center (Mecmesin | Help - Software).a
3 Out of the box (Factory default settings)
When you receive your Vector instrument, it will be configured with the following default settings
3.1 Main Display
3.1.1 Display Brightness
75%
3.1.2 Audio Volume
50%
3.1.3 Sensor Display
Value 1: Max Tension
Value 2: Live Reading
Value 3: Max Compression
Measurement Units: Newtons
3.1.4 Secondary Display
Live Graph
3.1.5 Main Button bar
Lock Display
Tare
Clear Maxima
Cycle through available Units
3.2 Settings
3.2.1 Time/Date
Time/Date: Not Set
Date: dd/mm/yyyy
Daylight Savings: Off
Units: Newtons or N.m
3.2.2 Display Settings
button 2: Tare
button 3: Clear Maxima
button 4: Cycle units
Toolbar lock: Off
Sleep mode: On
Audio: On
3.2.3 Sensor Settings
Top value: Maximum tension
Middle value: Live reading
Lower value: Maximum Compression
Operation mode: Break Detect
Break detect polarity: Auto
Low break threshold: 5% of load cell capacity
Force Drop: 90%
Time window: 100ms
Overload map: Off
Audio map: Off
X constant: 1.000
Data collection frequency: 200Hz
3.2.4 Alarm Settings
High Alarm: 100% capacity
High Pre-alarm: 50% capacity
Low Pre-alarm: 50% capacity
Low alarm: 100% capacity
Pass/Fail: Off
All Overload maps: Off
All Audio maps: Off
3.2.5 Statistics Settings
Sample size: 3
Auto Print: Off
Auto save to SD card: Off
Penetrometer mode: Off
3.2.6 Print Settings
Page Character width: 25
Auto Print: Off
Right justify: On
Print time/date: Off
3.2.7 Serial Settings: Both Ports
Baud Rate: 115200
Stop bits: 1
Parity bit: None
Carriage return: On
LIne Feed: On
Comma Separator: Off
Print: Off
Print sign: On
Print Unit: On
AFG Max Mode: Normal
Lock Passkey: Off
4 Use of peripherals
Your Vector Instrument transmits data via RS232 serial protocol. It is compatible with various peripheral devices and can also be connected to your Windows PC for use with Mecmesin's VectorPro Lite software for data capture, graphical plotting and results analysis. The table below describes the products and cables, which can be connected to your Vector Instruments.
|
Connection with: |
Cable required (Mecmesin part number) |
| Vector Force & Torque 'Smart' Adaptor For connecting Mecmesin 'Smart' loadcells and torque sensors (supplied as standard with VFTI. Order separately for use with VFG.) |
874-005 |
|
Test stands |
351-105 |
|
Interface cable to connect to column of MultiTest 0.5 & 1-dV test stand (extra length) |
351-105-V01 |
|
Interface cable to connect to RJ11 connector on rear panel of MultiTest-dV or Vortex-dV (VIC1 revision) |
351-110 |
|
Interface cable to connect to 15-way D connector on rear panel of MultiTest-dV or Vortex-dV (VIC3 revision) |
351-112 |
|
PC or printer via Serial port (9-way) |
351-107 |
|
PC or printer via Serial port (USB) |
351-109 |
|
PC or printer via Serial port (9-way) |
432-450 |
4.1 Surface features and connectors
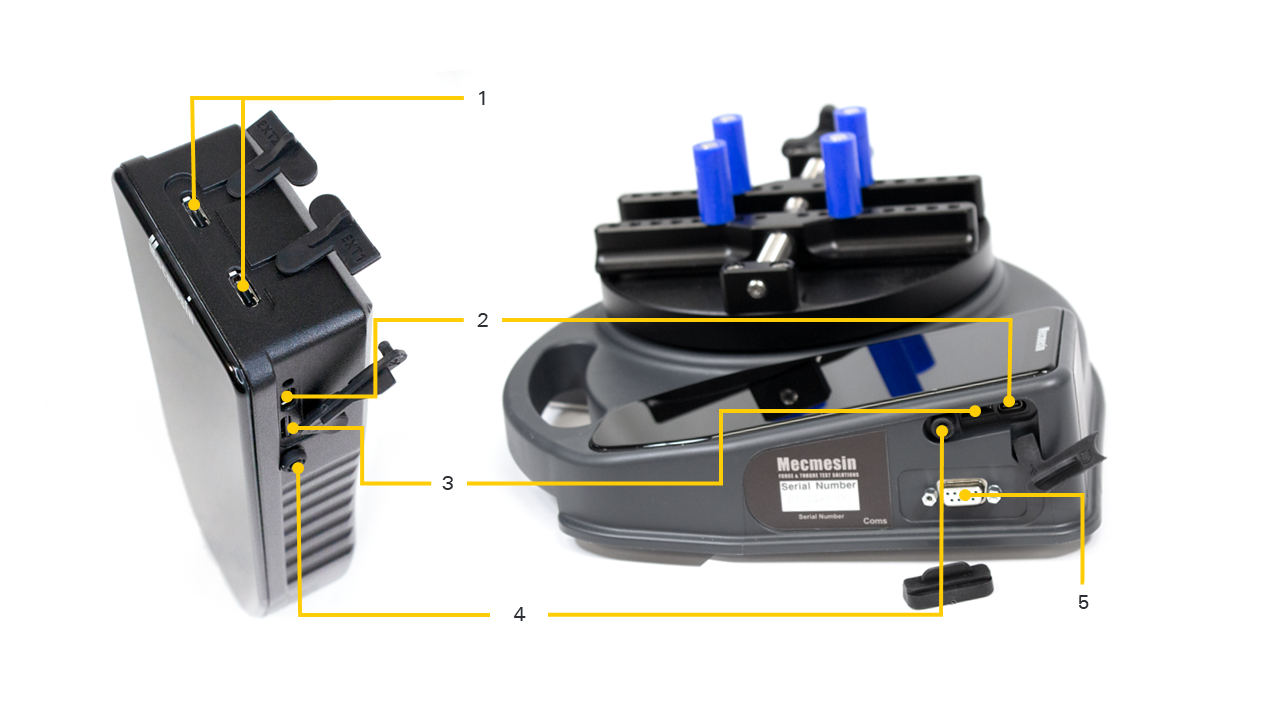
| 1 | External 1 and 2: These are serial I/O ports and can be used by Vector Force & Torque 'Smart' Adaptor, MultiTest-dV connect, serial printer. |
|---|---|
| 2 | USB-C port: This is used for charging the internal battery and for software updates. |
| 3 | Secure Digital (SD) card storage: microSD cards up to 32 GB are accepted. This is used for storing measurement raw data, statistical data (results only) and uploading data to the device (firmware updates, new configurations, etc.). |
| 4 | Power button: Hold for approx. 3 seconds to switch on or off. |
| 5 | 9-way D-Type connector for data communication and footswitch operation. VTG Only. |
It is recommended that the protective rubber covers be used whenever possible to avoid dust ingress. Also, although Vector Instruments are very robust, they are not indestructible and so we also recommend that the rubber perimeter bumper provided is used at all times.
5 External Inputs EXT1 and EXT 2 (VFG/VFTI only)
These ports are identical and may be used for the same purposes. With the correct corresponding cable (see "Use of Peripherals", above) they can be used to:
- connect to your Mecmesin-dV test stand
- connect to serial printers
- connect to external sensors (via an adapter box)
- connect to a PC serial port
5.1 MultiTest-dV connection
When connected to a MultiTest-dV test stand, the VFG/VFTI force or torque value is passed to the test stand. Simple pre-configured test methods can be executed by the dV test stand either as a stand-alone system or in conjunction with VectorPro Lite software. All data collection functions of the VFG are unaffected and the statistics mode of the VFG can be used, although at the time of writing there is no corresponding compatible statistics mode with VectorPro Lite.
5.1.0.1 Connecting a VFG to a MultiTest-dV motorised test stand
For this, you will require the correct interface cable(s) and your MultiTest-dV must be installed with Firmware release 3.1.4.0 or later. Please contact your local Mecmesin representative if you need assistance.
When the VFG is successfully connected to your MultiTest-dV test stand, the TEST STAND CONNECTED icon ![]() will show in the status bar.
will show in the status bar.
5.1.0.2 Connecting a VFTI to a Vortex-dV motorised torque stand
For this, you will require the correct interface cable(s) and your Vortex-dV must be installed with Firmware release 3.1.4.0 or later. Please contact your local Mecmesin representative if you need assistance.
When the VFG is successfully connected to your MultiTest-dV test stand, the TEST STAND CONNECTED icon ![]() will show in the status bar.
will show in the status bar.
While connected to your MultiTest-dV or your PC running VectorPro Lite, your system will treat the VFG/VFTI/VTG the same as an older AFG/AFTI or Tornado.
5.1.1 External sensors
When used with a 'Smart' Load Cell Adapter (Mecmesin part number 874-005), the VFG and VFTI are fully compatible with the Mecmesin 'Smart' sensor range. When an external sensor is connected, the primary sensor display will show the external sensor, regardless of whether or not there is an internal sensor present.
5.1.2 MultiTest-dV Test control
Unlike the AFG, the Vector Instruments do not have any test stand control features. These have been entirely delegated to the MultiTest-dV test stand and can be accessed via the Test Edit menu on the dV front panel. See your MultiTest-dV manual for details. This in no way affects operation of the MultiTest-dV with an AFG.
5.2 Serial Communications
5.2.1 Serial port settings
Your Vector Instrument serial port settings are defaulted to:
Baud Rate: 115200 (to match MultiTest/Vortex-dV settings) configurable from 9600 to 921600
Stop bit: 1
Parity bit: None
Carriage return: on
Line Feed: on
5.2.2 Print or transmit data to PC or printer
Printing and serial transmit are both instigated by the PRINT icon ![]() or the legacy TXD/AFG icon
or the legacy TXD/AFG icon ![]() . When you touch the icon, the current values shown in the primary sensor display are printed. If Print is selected from the statistics display then the table of values and results is printed or transmitted.
. When you touch the icon, the current values shown in the primary sensor display are printed. If Print is selected from the statistics display then the table of values and results is printed or transmitted.
5.2.3 Serial printer connection
Your serial printer will connect to one of the two EXT ports at the top of the VFG, or to the 9-way D-type connector of the VTG. Connection is confirmed by the serial icon in the status bar. When connected to a serial printer, the Print icon will send data to the printer in the format determined by the printer settings on the Vector Instrument.
5.2.4 PC serial connection
When connected to your PC serial port, data from the Vector Instrument may be sent directly to a PC. Printer settings are enabled for this mode, so the settings as configured in Printer Settings on the Vector Instrument affect PC serial data.
5.2.5 AFG serial protocol
The AFG serial protocol has been implemented, where appropriate, in your Vector Instrument so that if you are used to this workflow with older instruments then you can continue working in the same way with your Vector Instrument.
 primary
6 Touchscreen interface and features
6.1 Swipe navigation
You can navigate the available display screens on your Vector instrument using familiar 'swipe' actions.
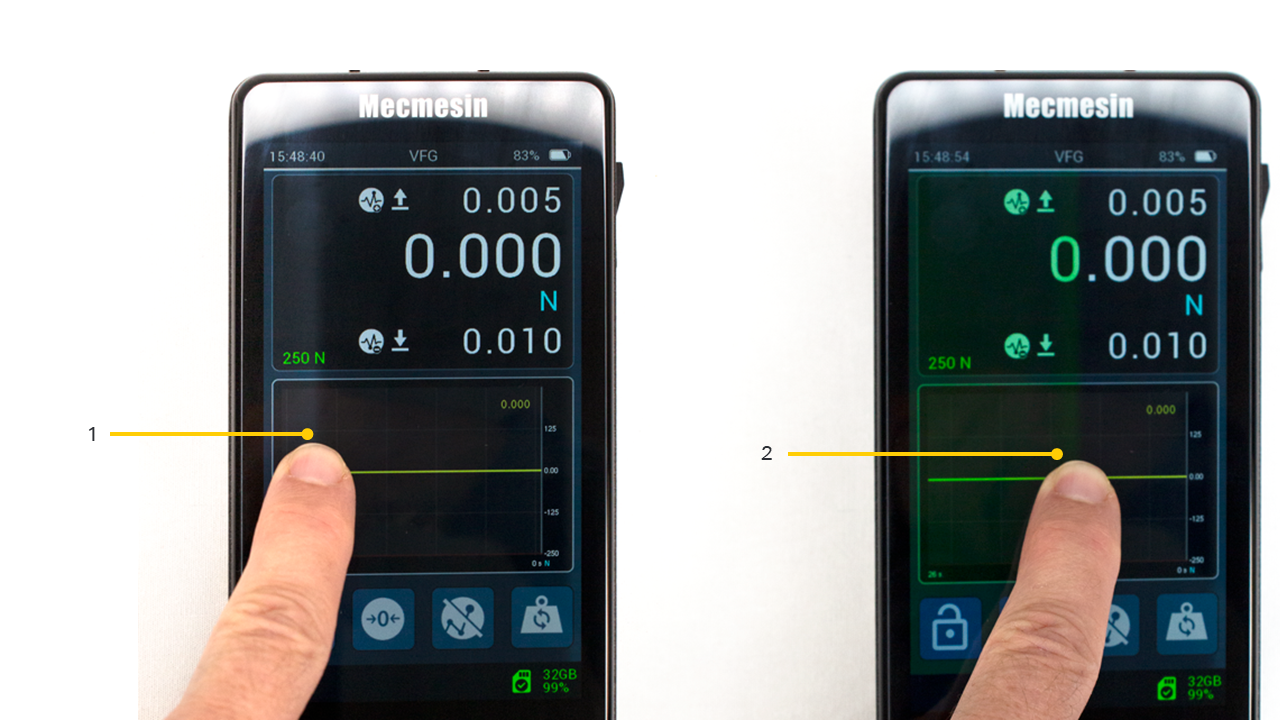
| 1 | Shaded region showing ‘grabbed’ area |
|---|---|
| 2 | Drag finger across |
Simply touch and hold the edge of the display area (with one finger) and then swipe to navigate available displays. You will notice a slight change in colour at the edge of the screen to acknowledge the touch-before-swipe action.
Navigate displays by swiping from 'left to right', 'right to left' and 'top to bottom' or 'bottom to top'.
Simply touch and hold the edge and move your finger in the direction you want to swipe.
Example display map:
Swipe in the direction of the arrows to access different display orientations:
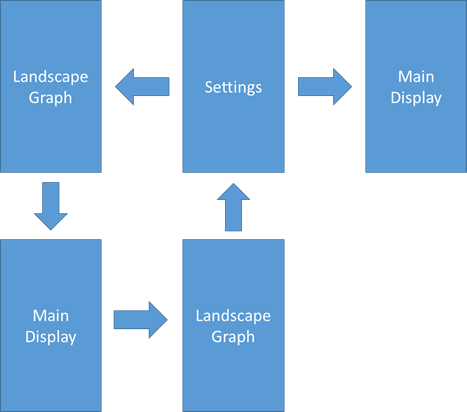
Vector Instrument Settings can also be accessed from the Information toolbar – see 'Information bar'.
Vector Instrument Landscape Graph can also be accessed from the Graph toolbar – see 'Secondary display'.
6.2 Vector OS icons
Vector OS is designed for touchscreens and uses touch-friendly icons and we do our best to create icons that are clear and reflect the subsequent functionality. These are described in this document and are accurate at the time of publication. We try to ensure that the latest iconography is reflected in this document, but icons are subject to change depending on firmware release version and customer feedback.
If there are any icons that are not clear then please contact Mecmesin Technical Support at support@mecmesin.com.
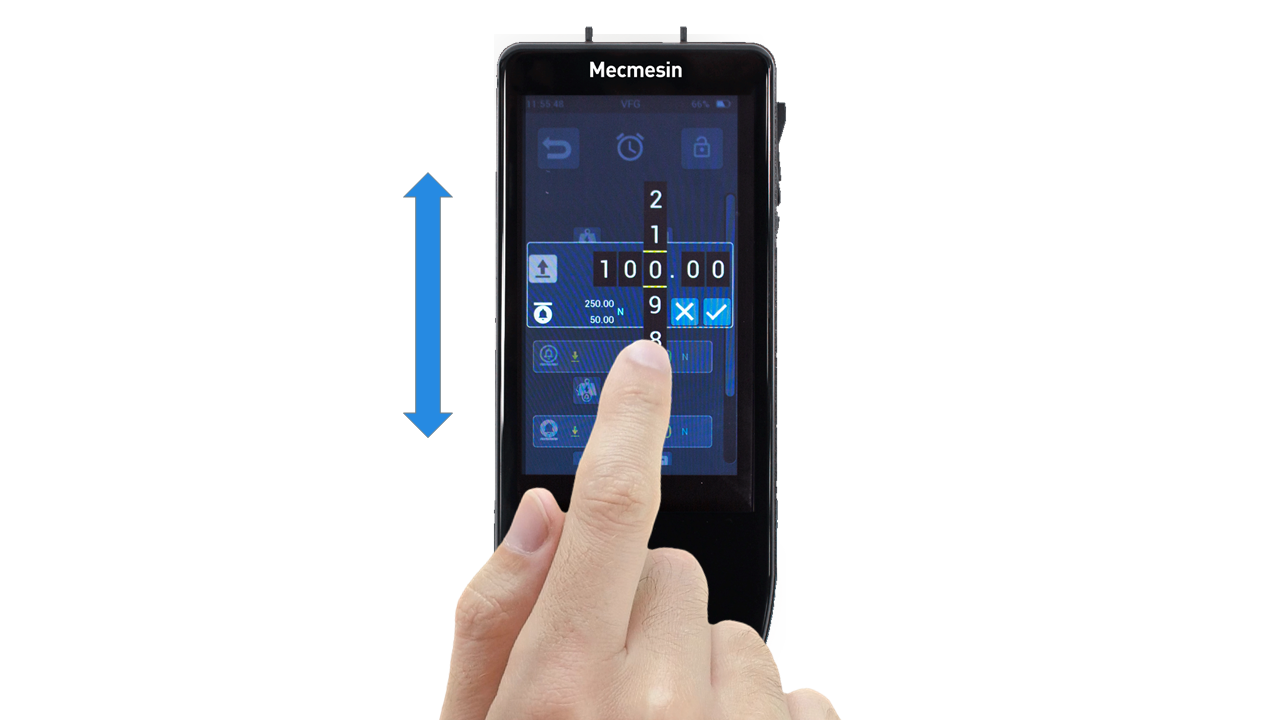
6.3 Numerical input wheel
Touch and hold, then drag your finger up and down through the available values. The allowable max and min values are indicated in the pop-up.
6.4 Scroll bars
This is the same as scroll bars seen on most PCs. Touch and hold, then drag the bar up and down to navigate long lists.
6.5 Multi-coloured LED
There is a multi-coloured LED just below the display that will communicate certain events, e.g., overload, warnings/alarms, etc.
6.5.1 During Use
Solid red: Overload condition ( a load of >125% of integrated sensor capacity has been applied).
Solid blue: The 'Alarm' limit has been reached.
Flashing blue: The 'Pre-alarm' limit has been reached.
Flashing blue and green: The 'Break' condition has been detected—as configured in Sensor settings.
6.5.2 While charging and Powered-off
Flashing Blue: Device is charging and currently is less than 100% charged. To see the state of charge, press the power button once.
Solid Green: Device is connected to the charger and at 100% charge.
6.6 Dual-zone instrument display
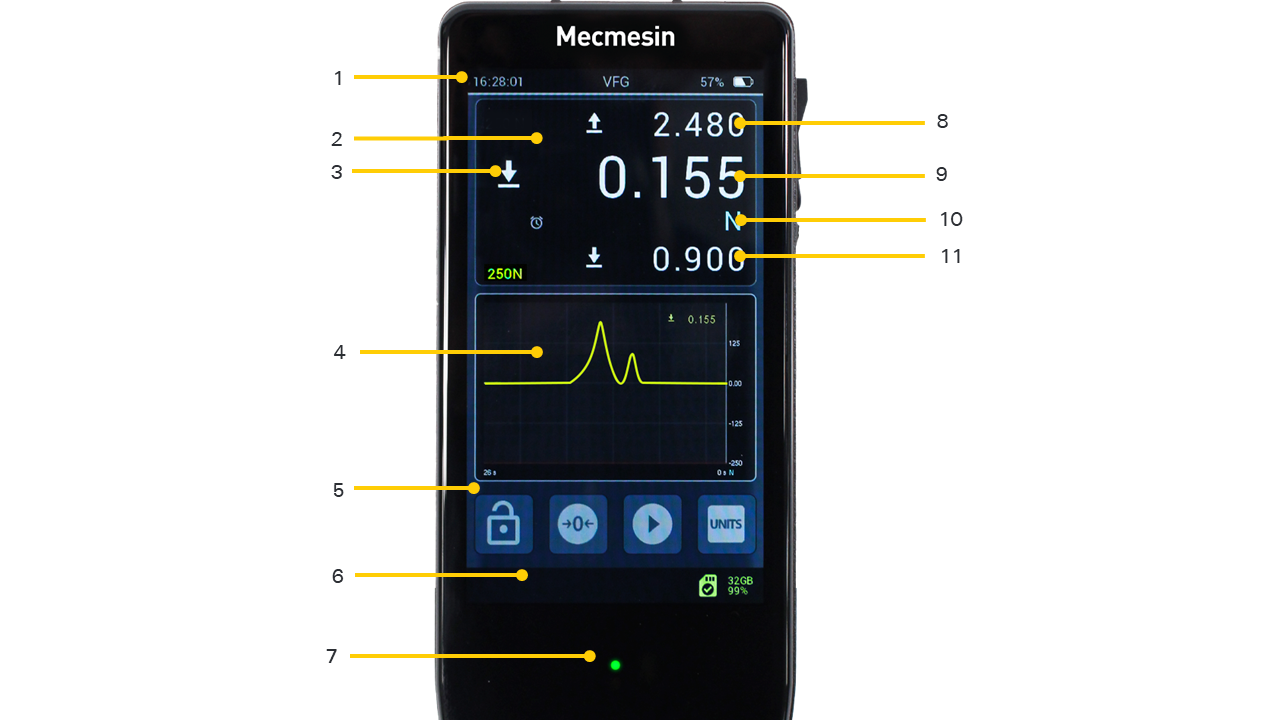
| 1 | Information bar—touch and hold to access the information toolbar |
|---|---|
| 2 | Primary sensor display—touch and hold to access the sensor toolbar |
| 3 | Load direction of live reading |
| 4 | Secondary display, configurable for graph (shown) or statistics—touch and hold to access the graph or statistics toolbar |
| 5 | Main button bar, configurable as shortcuts to quick access important functions for the way the instrument will be used |
| 6 | Status bar—touch and hold to access the MicroSD card toolbar |
| 7 | Status LED indicator |
| 8 | Maximum tension value reading |
| 9 | Live measured value reading |
| 10 | Units of measurement (shown on right-hand side), notifications such a alarms, break detected, are shown on the left-hand side |
| 11 | Maximum compression value reading |
6.6.1 Toolbars
Touch-and-hold on locations 1, 2, 4 and 6, above popup contextual toolbars, accessing further relevant functionality:
- Information toolbar.
- Sensor toolbar, below, left.
- Graph toolbar (when secondary display set to GRAPH MODE), below, centre.
- Statistics toolbar (when secondary display set to STATISTICS MODE), below, right.
- MicroSD card toolbar.
6.7 Information bar
The information bar shows:
- Current time
- Product name
- Battery charge status
- Some alarms—including calibration due, calibration overdue
6.7.1 Information toolbar
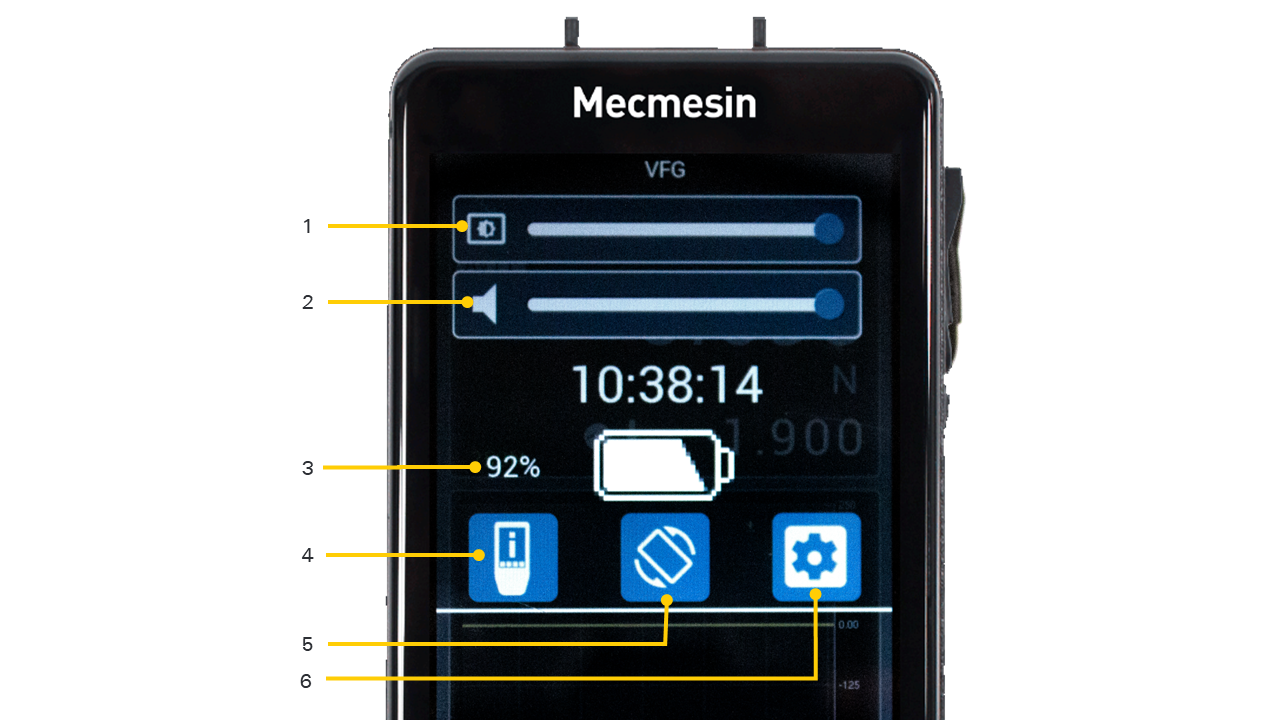
Touching and holding the information bar at the top of the display accesses the information toolbar with the following features:
- Brightness slider
- Sound volume slider (active from Vector OS version 1.0.7.0 onward)
- Battery charge status display
- Vector Instrument device info display
- Invert display button
- Access device settings
Touch the top bar of this screen again to exit without making changes.
6.8 Entering and exiting menus
Depending on the function of the on-screen icons they will behave differently when you activate them.
6.8.1 Menu icon
When a menu icon is activated, you will be presented with the underlying menu. For instance, touching any of the menu icons on the settings page will take you to the functionality for that item.
6.8.2 Selection icon
Some icons change colour to tell you that something has been selected and they behave like an ON/OFF switch. For instance the touch audio selection, penetrometer aggregate size.
6.8.3 Setting icon
Some icons take you to an input screen where you can set a value.
6.8.4 Common icons
Accept ![]()
Cancel ![]()
Go back ![]()
6.9 Primary sensor display
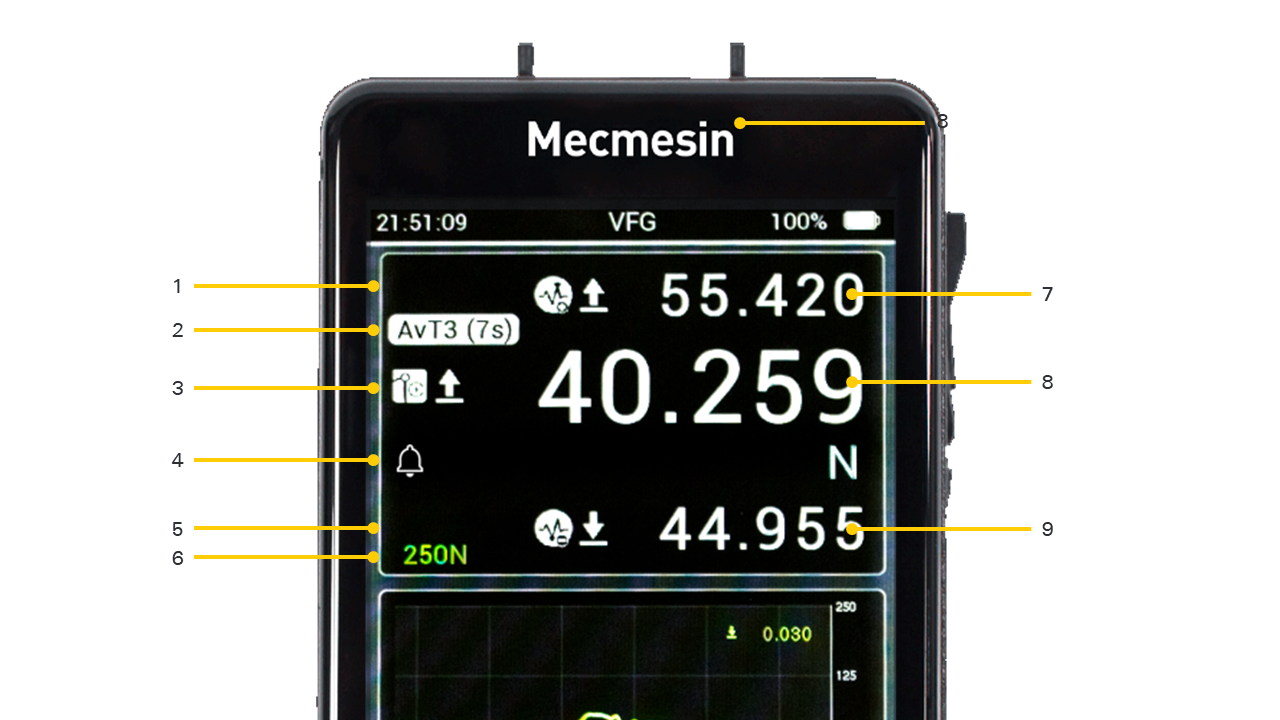
| 1 |
First row with top reading (showing maximum tension) |
|---|---|
| 2 | Second row (in this case showing average over time info) |
| 3 | Third row with information icons (OPERATION MODE and polarity) and main reading (showing primary measurement value) |
| 4 | Fourth row, Notification bar, for alerts and units of measurement (an alarm has been triggered and the current units setting is Newtons) |
| 5 | Fifth row with bottom reading (showing maximum compression) |
| 6 | Sixth row showing device capacity |
| 7 | Top reading (in this case showing maximum tension) |
| 8 | Main reading (in this case showing average value, but in other modes this will show the live value) |
| 9 | Bottom reading (in this case showing maximum compression) |
For VFG and VTG Tornado, the primary sensor display shows the internal sensor details by default. By default, the middle reading (shown in larger text size) is the live value with maximum tension and compression readings shown top and bottom. All three values are shown using the same units of measurement, as shown under the live reading.
For VFTI this will show the connected 'Smart' load cell.
From top to bottom, the primary display shows the following:
6.9.1 First row (top reading)
By default, this shows the maximum tension/clockwise value, but can be configured in the SENSOR SETTINGS page to show any one of six possible readings. The value can also be left blank. Select a reading value relevant to the set OPERATION MODE of the device—i.e. the type of test to be performed.
| Table of available reading values | |
|---|---|
| BLANK. The location will be empty. | |
| LIVE READING | |
| MAX TENSION | |
| MAX COMPRESSION | |
| 1st PEAK | |
| 2nd PEAK | |
| AVERAGE OVER TIME | |
6.9.2 Second row
Shows mode information: AVERAGE OVER TIME (AvT), MAXT, MAXC or MAXD status
6.9.3 Third row (main reading)
This functions and is configured in the same way as the first row, but displays the reading in larger text. It defaults to showing the live reading along with the polarity of signal (tension/clockwise, compression/anti-clockwise).
(See 'Configuring the primary sensor display', below).
6.9.4 Fourth row
This is where alerts are shown (to the left of the display) and units of measurement are shown on the far right.
Alerts available are as follows:
![]() PRE-ALARM. The hollow bell icon is used to show that the 'Pre-alarm' limit has been reached. This alarm self-clears as soon as the load drops below the alarm threshold.
PRE-ALARM. The hollow bell icon is used to show that the 'Pre-alarm' limit has been reached. This alarm self-clears as soon as the load drops below the alarm threshold.
![]() ALARM. The 'Alarm' limit has been reached. This icon is persistent until manually cleared.
ALARM. The 'Alarm' limit has been reached. This icon is persistent until manually cleared.
![]() OVERLOAD condition (>125% of integrated sensor capacity). This icon is persistent until manually cleared.
OVERLOAD condition (>125% of integrated sensor capacity). This icon is persistent until manually cleared.
![]() BREAK. The 'Break' condition has been detected - as configured in Sensor settings. This icon is persistent until manually cleared.
BREAK. The 'Break' condition has been detected - as configured in Sensor settings. This icon is persistent until manually cleared.
![]() 1st PEAK detected. According to the configured Settings (see later).
1st PEAK detected. According to the configured Settings (see later).
![]() 2nd PEAK detected. According to the configured Settings (see later).
2nd PEAK detected. According to the configured Settings (see later).
![]() PASS. According to the configured Settings (see later).
PASS. According to the configured Settings (see later).
![]() FAIL. According to the configured Settings (see later).
FAIL. According to the configured Settings (see later).
Also shown in the fourth row is the current unit of medasurement.
6.9.5 Fifth row (bottom reading)
This functions and is configured in the same way as the first and third rows. By default, it shows the Maximum Compression/Anti-Clockwise value.
(See 'Configuring the primary sensor display', below).
6.9.6 Sixth row
This shows the device capacity.
6.9.7 Configuring the primary sensor display
The primary sensor display can be changed to show different combinations of reading values according to your preference, as explained above. When you receive your Vector Instrument there will be three reading values that are set as defaults; Maximum tension, at the top of the display (first row), maximum compression at the bottom of the display (fifth row) and the live measured value in the middle of the display (third row).
To change them, first access the Sensor Settings page![]() .
.
On this page, the top three options are for the top value (first row) ![]() , middle value (third row)
, middle value (third row)![]() and bottom value (fifth row)
and bottom value (fifth row) ![]() .
.
Each of these values can be configured to show one of the reading values refernced in 'Table of available reading values', above.
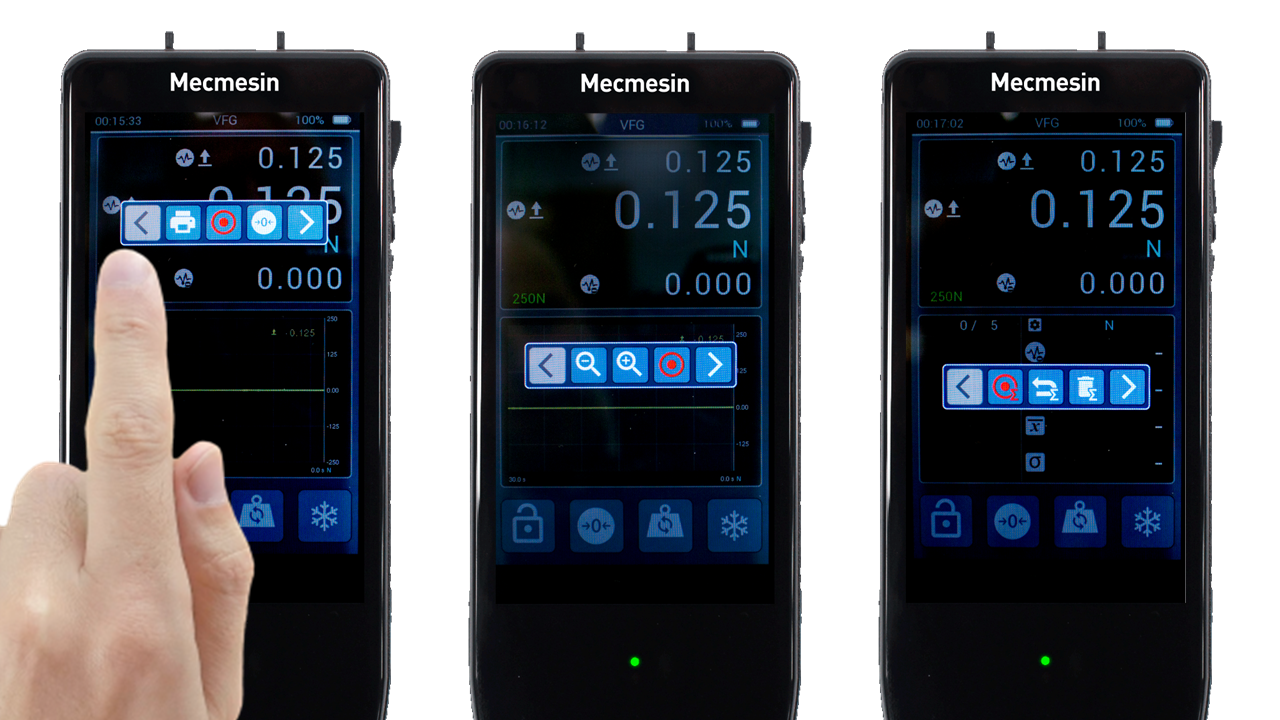
6.9.8 Sensor Toolbar
Touch and hold the primary sensor display to access the Sensor toolbar (see 'Toolbars', above).

This is a scrollable toolbar including icons (from left to right) for:
- Print/Transmit current reading
- Start/Stop recording data
- Tare - clears all sensor display values
- Untare - removes the last applied tare
- Clear max/min
- Clear break icon
- Clear alarms
- Clear overload icon
- Show sensor information - see "How To" show sensor information later in this manual for details
- Enter adjust/calibration mode (passkey protected)
6.10 Secondary Display
By default, the secondary display shows the Load vs Time graph in a rolling 10-second window but can be configured to show other views.
Touch and hold the Secondary display area to access the toolbar corresponding to the currently configured view. These are described below.
6.10.1 Configuring the Secondary Display
The secondary display can be configured to show one of the following options:
- Live graph of current measurement (default)
- Statistics view
This is done from the secondary display toolbar. Touch and hold the secondary display until the toolbar is shown. scroll to the right until the desired setting icon is seen and select it. The selected mode is latched until changed again.
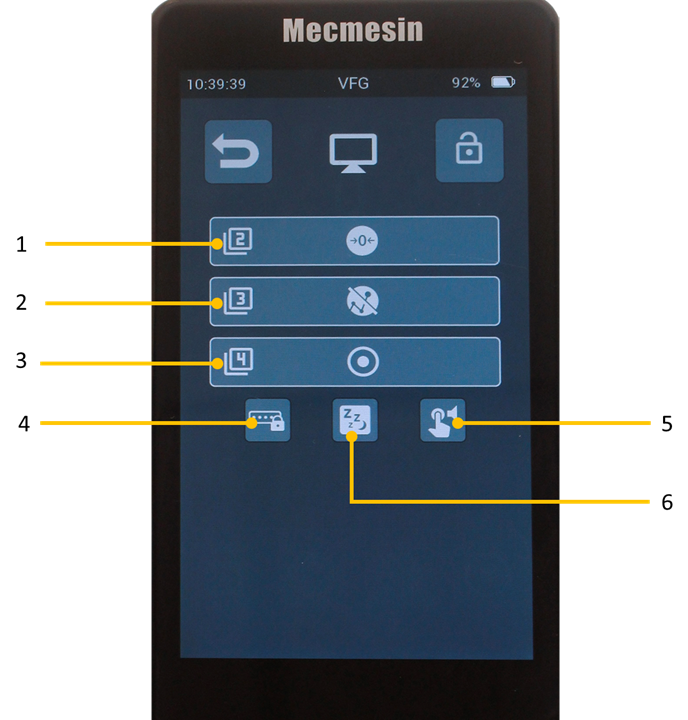
| 1,2,3 | Main button bar allocation |
|---|---|
| 4 | Toolbar lock - when activated, this option disables operator access to the primary display toolbars. |
| 5 | Sleep mode - when activated, this option dims the display after 5 minutes of inactivity |
| 6 | touch audio - when activated, a sound will be made every time an active item is touched (buttons, icons etc..) |
6.10.2 Graph Display
A live graphical representation of the testing taking place can be shown in the secondary display area, below the primary sensor display. This is in the form of a scrolling window, showing force/torque vs time. The time axis can be made faster or slower by selecting the “zoom-out” and “zoom-in” buttons on the graph toolbar menu. The graph may be zoomed in also by using the 'pinch-zoom' action typical of most touch displays.
To start and stop recording the test graph, touch the “PLAY” button. This can be accessed either from the Graph toolbar menu or it can be one of the configurable buttons on the main button bar below the secondary display. The second time the “PLAY” button is touched the test graph will be reviewed to fit the available window. If the graph window on the main display is not big enough then swipe to the right or select the appropriate option from the graph toolbar to see a full-screen version of the graph.
The graph toolbar menu can be accessed by touching and holding inside the graph window.
6.10.3 Graph toolbar
Touch and hold the graph display to reveal the graph toolbar (see 'Toolbars', above).
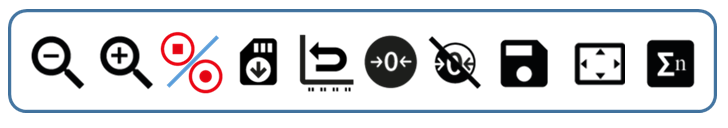
This is a scrollable toolbar including icons (from left to right) for:
- Zoom out / lengthen time axis
- Zoom in / shorten time axis
- Start/Stop recording data
- Recall last saved file from SD
- Reset graph
- Tare current sensor reading
- Untare current sensor reading
- Save graph
- Go to large graph display
- Show statistics Mode
6.10.4 Statistics Mode
If you enter Statistics Mode, the test graph is replaced by a table to contain the sample results and some statistics about them. Settings for the table can be found on the Device Settings page. You can configure the number of measurements to include in your results, which result to use, whether to print automatically and whether to save automatically.
The statistics mode uses the break detect (% force drop over time) to determine if a test has finished and automatically stores the result and waits for the next.
The most recently stored result can be deleted and repeated, or the whole set can be abandoned at any time. Some actions for statistics mode can be found in the statistics toolbar.
6.10.5 Statistics toolbar
Touch and hold the Statistics display to reveal the statistics toolbar.

This is a scrollable toolbar menu including icons for:
- Start/Stop measurement set
- Reset—abort measurement set (delete all measurements)
- Delete last measurement
- Print statistics data
- Save to microSD card
- Settings access
- Exit statistics mode and return to graph mode
6.11 Main button bar
This contains some quick access shortcuts to functions that could be common to your usage. There are four available buttons, three of which can be configured according to preference via the Display Settings Page (see later).
6.12 Screen lock
If you touch and hold this button, the screen lock is activated, which removes touch sensitivity from the display. To turn off the lock (unlock), touch and hold the lock icon while touching and releasing the key icon.
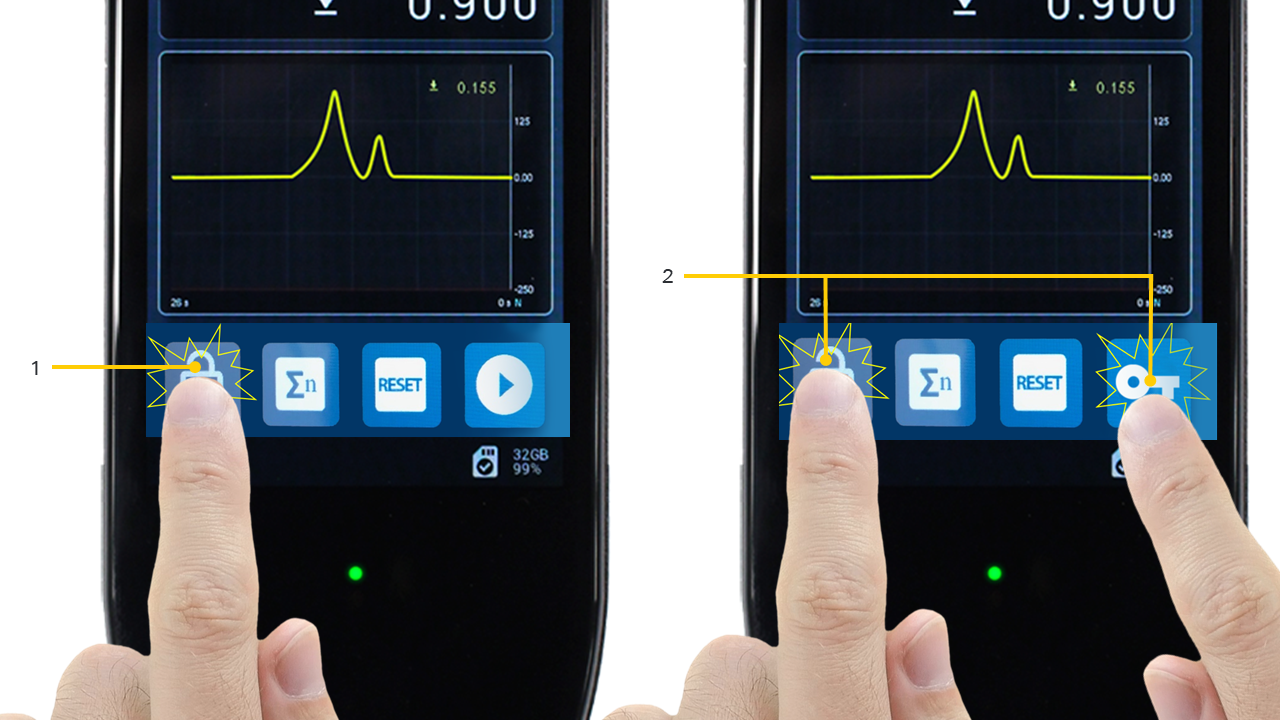
| 1 | Lock: Touch and hold for 0.5 seconds |
|---|---|
| 2 | Unlock: Touch and hold the lock button while touching and releasing the key button |
6.13 Status bar
This will show information about connections, system alarms and the microSD card, including:
- System fault
- USB connected
- Test stand connected
- Printer connected
- MicroSD Card mounted (includes total capacity and % available)
Touch the status bar to access the microSD toolbar.
6.14 MicroSD card toolbar
![]()
- Start/Stop data storage (also applies to test graph)
- Retrieve from microSD card (applies to most recently saved item only)
- Enter microSD card management page
- Eject microSD card
- Retrieve last saved data set
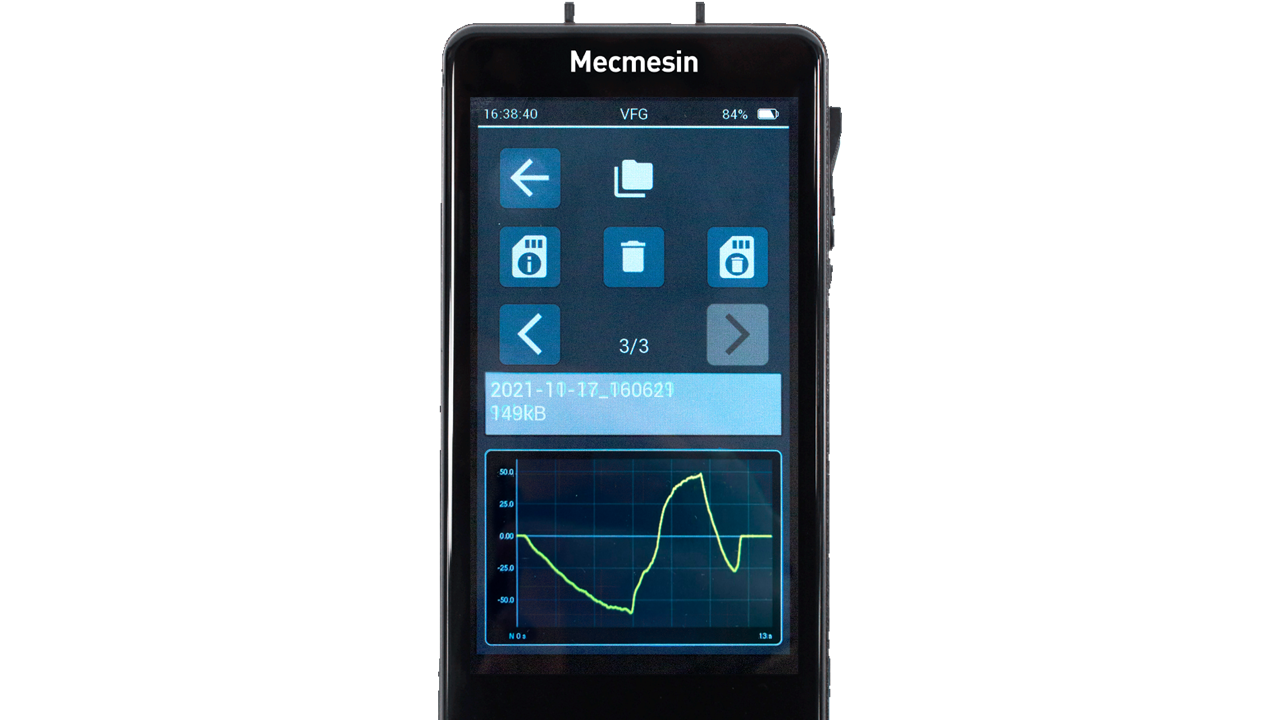
6.14.1 MicroSD card management screen
This screen allows you to access previously saved test data.
![]()
| 1 | MicroSD card management screen indicator |
|---|---|
| 2 | Go back |
| 3 | Deletion of individual data sets. (*) |
| 4 | Access to microSD card info |
| 5 | Previous data set |
| 6 | Current viewed data set filename and file size |
| 7 | Format the microSD card NOTE: This cannot be undone and all data will be lost! |
| 8 | Current data set / total number of data sets on the microSD card |
| 9 | Next data set |
| 10 | Current data set graph |
6.15 Large format graph
This can be accessed either from the main display graph toolbar or by swiping 'right-to-left' from the main display. This graph can be used if more visual detail is required.
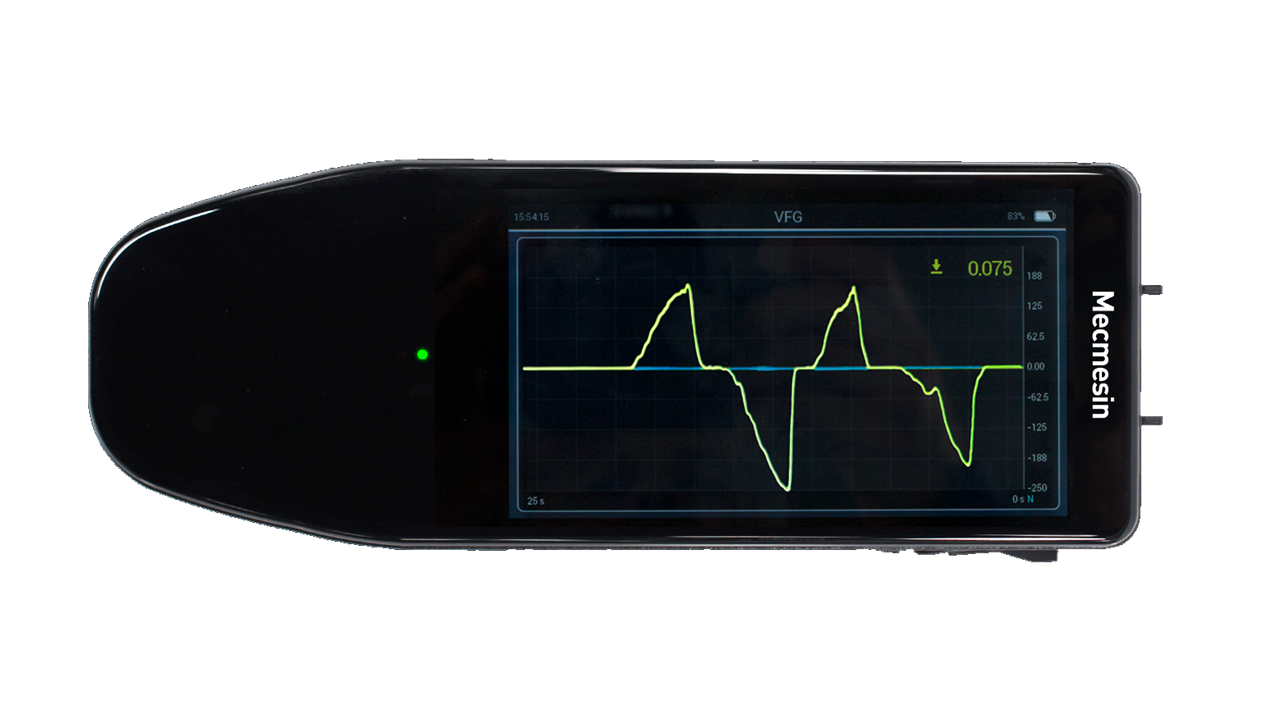
6.16 AFG emulation
6.16.1 AFG buttons
For those of you who are used to the button functions of the AFG mk4 handheld force gauge from Mecmesin, we have provided emulation of some of the features of that gauge.


These can all be selected to be displayed on the main button bar.
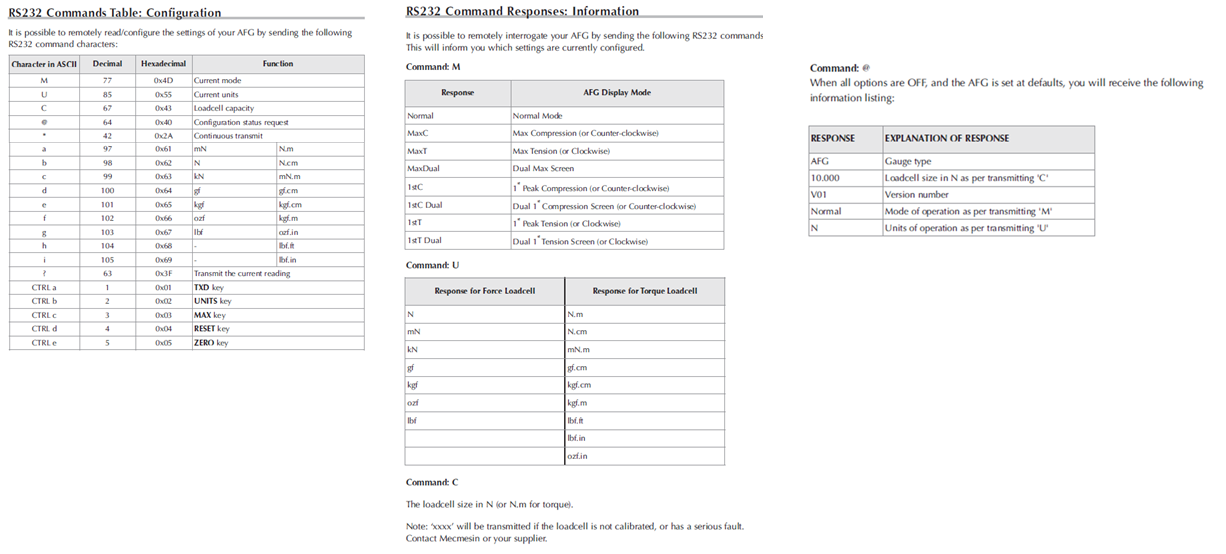
6.16.2 Serial protocol
We have also emulated the AFG serial communications protocol so that the following serial commands may be used with your Vector Instrument in the same way as for an AFG, AFTI or Tornado instrument.
7 Device settings
![]()
This is where many of the device settings can be changed. This page may be locked for access, or each individual settings page may be locked. If any locks are present then the passkey must be entered to make changes.
Just touch this icon to set the passkey:
![]()
Any of the settings categories can be individually locked from further configuration. Also, by using the global Settings Lock, the whole Device Settings page can be passkey protected.
Within the display settings category, there is an option to also specifically lock the toolbars. With these three options, the flexibility of available lock configurations can cope with the most demanding requirements for operational security.
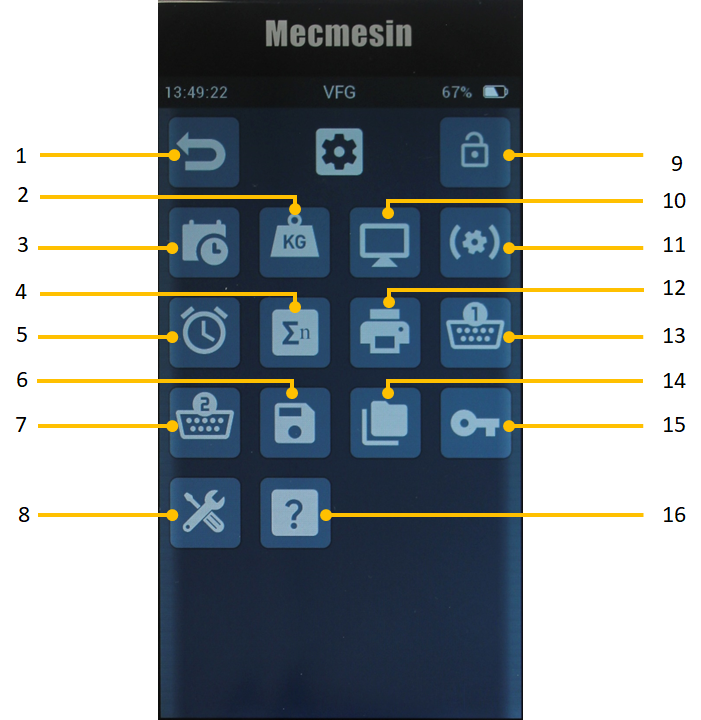
| 1 | Go back |
|---|---|
| 2 | Units of measurement |
| 3 | Time/Date |
| 4 | Statistics mode |
| 5 | Alarm settings |
| 6 | Save Configuration |
| 7 | Serial COM Port2 (EXT2) settings |
| 8 | Device management settings |
| 9 | Menu Lock |
| 10 | Display settings |
| 11 | Sensor settings |
| 12 | Printer |
| 13 | Serial COM Port 1 (EXT1) settings |
| 14 | Recall saved configuration |
| 15 | Security settings |
| 16 | Configure Device (only visible for Service Engineers) |
7.1 Date and time
![]()
![]() Set time
Set time
![]() Set date
Set date
![]() Change date format (switch from DD/MM to MM/DD)
Change date format (switch from DD/MM to MM/DD)
![]() Switch daylight savings on/off (this adds an hour to the current time if toggled on)
Switch daylight savings on/off (this adds an hour to the current time if toggled on)
7.2 Units of measurement
![]()
This page allows you to change the units of measurement for the displayed sensor.
For force sensors, the following units can be selected:
mN, N, kN, gf, kgf, ozf, lbf
For torque sensors, the following are available:
mN.m, N.cm, N,m, ozf.in, lbf.in, lbf.ft
7.3 Display
![]()
![]()
![]()
![]()
The first three options here are for the main button bar. The four buttons of the functions bar on the main display are configurable, with the exception of the display lock button, which is always present. The remaining three buttons can be configured to be any of the following functions:
| Tare | |
| Clear Max values | |
| Cycle through units | |
| Print or Transmit | |
| Untare | |
| Statistics: Record / Stop | |
| Statistics: Reset | |
| Statistics: Delete last sample | |
| Statistics: Save to microSD card | |
| Begin SD storage | |
| Enter statistics mode | |
| Retrieve from SD | |
| Eject microSD card | |
| Save to microSD card | |
| Freeze display | |
| MAX (AFG emulation) | |
| UNITS (AFG emulation) | |
| TXD (AFG emulation) | |
| ZERO (AFG emulation) | |
| RESET (AFG emulation) |
![]() Toolbar lock selector. By selecting this you disable all display toolbars.
Toolbar lock selector. By selecting this you disable all display toolbars.
![]()
![]() Enable touch sounds - makes a sound everytime an on-screen feature is selected.
Enable touch sounds - makes a sound everytime an on-screen feature is selected.
7.4 Sensor settings
![]()
Here, you can configure various settings regarding the primary sensor. For the VFG and VTG, this is the internal sensor. For the VFTI, it is the sensor connected to EXT1. The meanings of these parameters are explained elsewhere in this manual.
![]() Top display value
Top display value
![]() Main display value
Main display value
![]() Bottom display value
Bottom display value
Each of these values can be configured to show the following options:
| Blank | |
| Live Value | |
| Maximum Tension (or Clockwise Torque) | |
| Maximum Compression (or Anti-clockwise Torque) | |
| 1st Peak | |
| 2nd Peak | |
| Average over Time |
![]() Sensor operating mode: Including the following options
Sensor operating mode: Including the following options
| break detect | |
| Twin Peaks | |
| Average over time |
![]() Select break-detect polarity:
Select break-detect polarity:
| Positive (tension, clockwise) | |
| Negative (compression, anti-clockwise) | |
| Auto (triggers in either direction) |
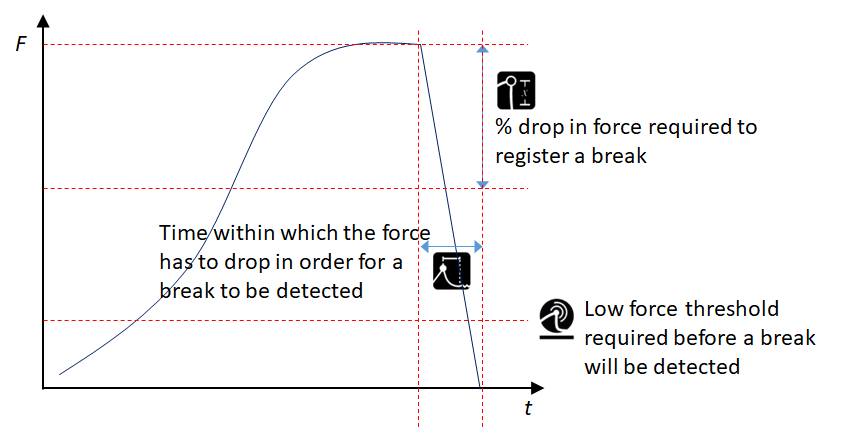
![]() Low-break threshold (by default this is set to 5% of sensor capacity, but is configurable up to 25% of capacity)
Low-break threshold (by default this is set to 5% of sensor capacity, but is configurable up to 25% of capacity)
![]() % drop required to detect a break
% drop required to detect a break
![]() Time window within which break will be detected
Time window within which break will be detected
 Map to the overload channel - this icon appears in other areas also. It allows events to use the overload signal to stop a test when the instrument is used with a MultiTest dV system.
![]() Audio alert on break
Audio alert on break
![]() Av/T start load
Av/T start load
![]() Av/T stop load
Av/T stop load

 Av/T stop time
![]() Multiplication factor
Multiplication factor
![]() Data acquisition rate
Data acquisition rate
7.5 Break Detection - how it works
![]()
There is a simple break detection mechanism included in your Vector Instrument. It takes the parameters of low force threshold, % drop and a time window to calculate an approximate break point in your test data.
These parameters can be configured in the Sensor settings page as described above.
If the time window is set to 0.0s, then the window is undefined and break will be detected when the %drop is registered no matter how long it takes.
The Break Detect can be tied to the overload channel so that when used in conjunction with a MultiTest-dV test stand the break detect can instruct the test stand to stop the test. It can also be configured to make an audible sound upon detection of a break.

7.5.1 Mapping Break to the Overload channel
The Break event can be mapped to the overload channel by selecting . This does not register an overload on the device or show the overload icon, but when the instrument is used as the sensor in a MulitiTest-dV system, this has the advantage of commanding the test to stop when the designated state is registered.
7.5.2 Mapping Break to Audio
You can choose to play the alert sound when a Break is detected by selecting ![]()
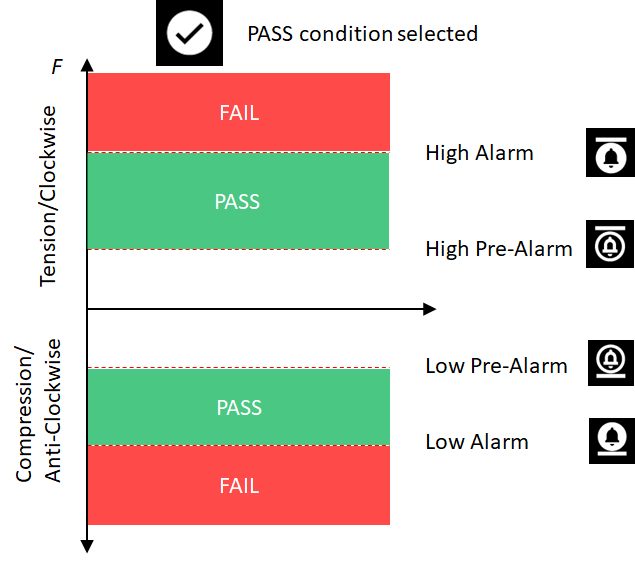
7.6 Alarm settings
![]()
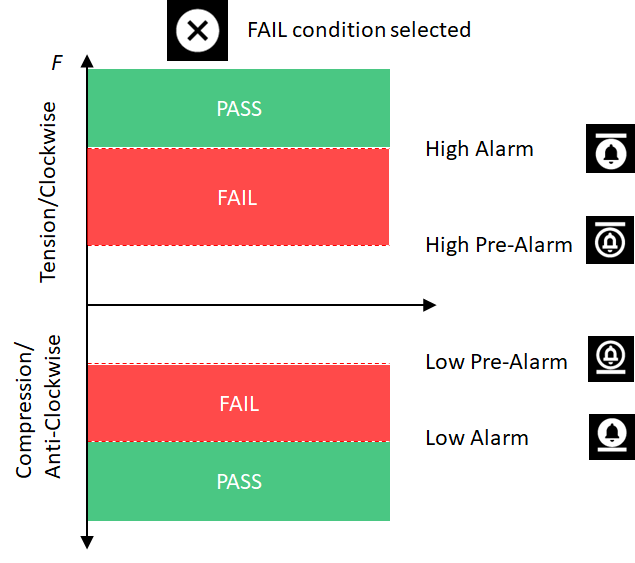
In V1.0.8.0 the Alarm settings were separated out into their own settings page. Previous versions had the alarm settings as part of the sensor settings page. On this page, you can set the low, high and pre-alarm values. You can also choose whether or not to use these values to determine PASS/FAIL.
The band between the pre-alarm and alarm can be designated to PASS or FAIL. If this band is set to register a PASS, a popup will appear showing the PASS/FAIL state and asking whether to print or to remove the popup. Taring the display will clear the PASS/FAIL state.
On the settings page, the configurable alarms are shown in the order in which they are actioned, from high alarm down to low alarm.
![]() High alarm - this can be tied to the overload channel and also be configured to sound the annunciator
High alarm - this can be tied to the overload channel and also be configured to sound the annunciator
![]() High pre-alarm - this can be tied to the overload channel and also be configured to sound the annunciator
High pre-alarm - this can be tied to the overload channel and also be configured to sound the annunciator
![]() Low pre-alarm - this can be tied to the overload channel and also be configured to sound the annunciator
Low pre-alarm - this can be tied to the overload channel and also be configured to sound the annunciator
![]() Low alarm - this can be tied to the overload channel and also be configured to sound the annunciator
Low alarm - this can be tied to the overload channel and also be configured to sound the annunciator
 Choose whether or not to report PASS/FAIL and whether or not to designate the band between pre-alarm and alarm as PASS or FAIL—this can be tied to the overload channel and also be configured to sound the annunciator.
7.6.1 PASS/FAIL
The alarms may be configured to determine a PASS or FAIL condition as follows. This is switched on or off in the Sensor Settings as described previously in this manual.
7.6.2 Mapping alarm states to the Overload channel
Each of the alarm states along with the PASS/FAIL state can be mapped to the overload channel by selecting . This does not register an overload on the device or show the overload icon, but when the instrument is used as the sensor in a MulitiTest-dV system, this has the advantage of commanding the test to stop when the designated state is registered.
7.6.3 Mapping alarm states to sound
You can choose to play the alert sound when each alarm state has been reached by selecting ![]()
7.7 Printer settings
![]()
![]() Page character width
Page character width
![]() Auto Print after break detected
Auto Print after break detected
![]() Right Justify
Right Justify
![]() Print time/date
Print time/date
7.8 Serial COM Port 1 (EXT1) settings
![]()
![]() Baud rate
Baud rate
![]() Stop bit
Stop bit
![]() Parity bit
Parity bit
![]() Carriage return
Carriage return
![]() Line feed
Line feed
![]() Include comma delimiter
Include comma delimiter
![]() Send output to printer
Send output to printer
![]() Print "+" or "-" sign
Print "+" or "-" sign
![]() Print units of measurement
Print units of measurement
7.9 Serial COM Port 2 (EXT2) settings
![]()
![]() Baud rate
Baud rate
![]() Stop bit
Stop bit
![]() Parity bit
Parity bit
![]() Carriage return
Carriage return
![]() Line feed
Line feed
![]() Include comma delimiter
Include comma delimiter
![]() Send output to printer
Send output to printer
![]() Print "+" or "-" sign
Print "+" or "-" sign
![]() Print units of measurement
Print units of measurement
7.10 Statistics settings
![]()
![]() Number of samples to be included.
Number of samples to be included.
![]() Send results to printer upon completion.
Send results to printer upon completion.
![]() Send results to microSD card upon completion.
Send results to microSD card upon completion.
 Auto-reset for next reading. Clears break automatically once value is recorded.
![]() Penetrometer mode.
Penetrometer mode.
![]() Aggregate size for Penetrometer Mode (only visible if Penetrometer mode is selected). If this icon is unchecked then the 8mm aggregate MPa conversion is used, when checked the 16mm aggregate conversion is used.
Aggregate size for Penetrometer Mode (only visible if Penetrometer mode is selected). If this icon is unchecked then the 8mm aggregate MPa conversion is used, when checked the 16mm aggregate conversion is used.
7.11 Footswitch settings (VTG Tornado only)
![]()
These are digital inputs that allow certain functions of the Vector Instrument to be activated by an external input. As of version 1.0.8.0, the Footswitch is available in the VTG Tornado only. The VTG has a single footswitch connected via the 9-way D-type connector. Functions allowed are as follows:
| Tare | |
| Clear Max values | |
| Cycle through units | |
| Print or Transmit | |
| Begin recording | |
| Stop recording | |
| Save to microSD card | |
| Freeze display | |
| MAX (AFG emulation) | |
| TXD (AFG emulation) |
7.12 Save configuration
![]()
Your Vector Instrument allows you to save up to 7 different configurations, which can be loaded directly to the instrument. This can be used to save setups for different users, or perhaps where different alarm settings are used for different samples etc.
If you want to save the current configuration of your device select an available configuration ID.
![]()
![]()
![]()
![]()
![]()
![]()
![]()
7.13 Load Configuration settings
![]()
If there are saved configurations available then this settings page enables you to select one for loading onto your instrument, Simply select the configuration ID ![]()
![]()
![]()
![]()
![]()
![]()
![]() and confirm when prompted.
and confirm when prompted.
7.14 Device Management settings

Here you can perform some high-level functions, including:
![]() Save all information pages to microSD card
Save all information pages to microSD card
![]() Reset to Factory defaults
Reset to Factory defaults
![]() Update sensor firmware (if one is available)
Update sensor firmware (if one is available)
7.15 Security settings
![]()
You can set a 6-digit passkey to restrict access to some, or all, of the available settings. By touching the Lock/Unlock icon on each individual settings page, or at the top of the Device Settings page, you can control access to different aspects of the Vector Instrument configuration. When trying to unlock any one of those locked settings the passkey must be entered first.
7.15.1 Passkey first-time set
The passkey is set by default to 000000. To set the passkey, touch the Unlock icon:
![]() Unlock
Unlock
This will show the passkey as ******. Touch on this and you can then enter a 6-digit number. When finished, touch accept and your new passkey is set.
7.15.2 Passkey change and subsequent use
To access the passkey setting page you must enter the existing passkey.
8 How-to guides
8.1 Power ON / OFF
To power the device on it needs to have some charge in the battery.
In compliance with shipping regulations, to avoid any chance of accidental power-on during shipping, the device will auto power OFF if the power button is held for more than 5 seconds.
To power the device ON: Press the power button and hold until the Vector logo is displayed, then you can let go. The device should power on to a live measurement display.
If the device is charging at the time of powering on, the Vector logo may only be shown very briefly, or in some cases not at all. In this case, the device will power on directly to the main display.
To power the device OFF: Press and hold the power button until the main display turns off. If the device is charging, the charge status display will be shown for a few seconds before the display powers down.
8.2 Check charge status while charging
If the device is powered OFF and you want to see the charge status while it is charging, simply press the power button once and the current charge status will be displayed for 5 seconds.
8.3 Reset to Factory Settings
If you want to revert to factory defaults, go to the Device Settings page and select the "reset" option.
![]() Device Management settings
Device Management settings
![]() Reset to Factory Settings
Reset to Factory Settings
8.4 Show instrument information
![]() To view your instrument information, activate the Information toolbar by touching the Information bar, and selecting the 'Device Info' icon (pictured left).
To view your instrument information, activate the Information toolbar by touching the Information bar, and selecting the 'Device Info' icon (pictured left).
Information displayed includes:
- firmware (FW) version of Vector OS
- hardware version of your instrument
- Mecmesin serial number of your instrument
- a Universally Unique Identifier (UUID) for diagnostic purposes
8.5 Show sensor information
To show information about the sensor currently connected to your Vector Instrument, touch and hold the sensor display to activate the sensor toolbar.
Scroll to find and select the Sensor info icon.
Information displayed includes:
- Device name
- firmware version
- hardware version
- SENSOR serial number - this is different to the Instrument serial number
- last calibration
- calibration due date
- max and min load encountered
There are also four buttons displayed that allow the following:
![]() Display overload details: This will show all overloads encountered by the sensor. This is a permanent record and cannot be cleared.
Display overload details: This will show all overloads encountered by the sensor. This is a permanent record and cannot be cleared.
![]() Save Sensor information to the microSD card
Save Sensor information to the microSD card
![]() Update Sensor firmware - if a more recent version of sensor firmware is available then it can be updated using this option
Update Sensor firmware - if a more recent version of sensor firmware is available then it can be updated using this option
![]() Check sensor. This runs a routine that will measure the mV baseline of the sensor and also activate precision shunt resistors in the compression and tension arms of the load cell bridge circuit.
Check sensor. This runs a routine that will measure the mV baseline of the sensor and also activate precision shunt resistors in the compression and tension arms of the load cell bridge circuit.
Four values are displayed once the check is complete:
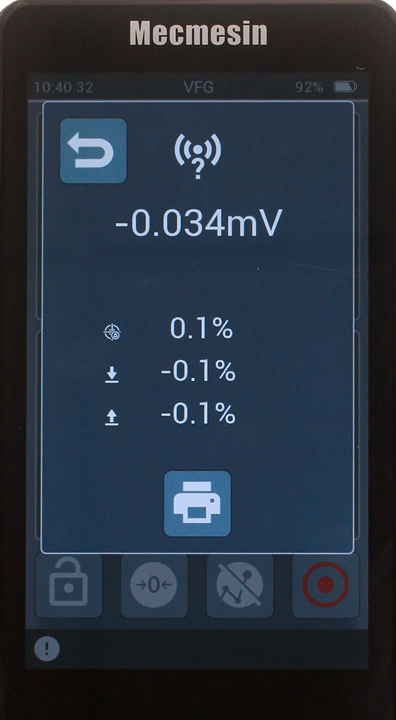
- mV baseline of the sensor
- % change since the last check
- compression shunt deviation from nominal
- tension shunt devitation from nominal
The expectation is that the shunt values would be within the design specification of the instrument.
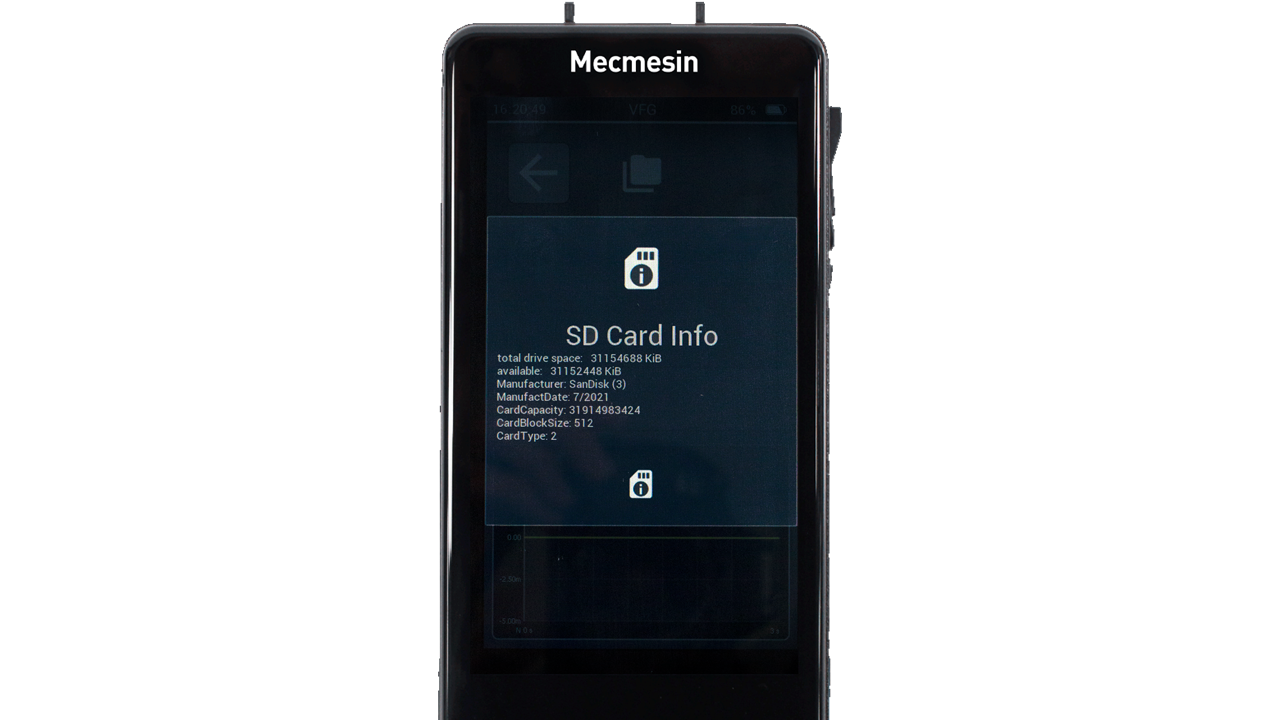
8.6 Show microSD Card Information
If a microSD card is currently fitted into your Vector Instrument, select the microSD card toolbar by touching and holding the status bar.
Select the Info icon![]()
Information displayed includes:
- Total capacity
- Available storage space
- Manufacturer and microSD card details
8.7 Store Device Diagnostic information to the microSD card
In requesting product support from support@mecmesin.com you may be asked to share the instrument diagnostics with us. You can store all information pages - Instrument, Sensor, SD card, and all device settings - to the SD card by accessing the Device Management settings page ![]() and choosing "export device information"
and choosing "export device information" ![]() .
.
You can then share the resulting file with your support Engineer.
8.8 Freeze (Pause) the Display
To freeze or pause the display, place the Freeze button ![]() onto the main button bar. To freeze, touch the button and again to unfreeze. Measurement is suspended while the display is frozen.
onto the main button bar. To freeze, touch the button and again to unfreeze. Measurement is suspended while the display is frozen.
8.9 Transmit or Print a single Maximum value only
Sometimes, it's useful to only transmit the last recorded Maximum value. There are two ways to do this with your Vector Instrument.
8.9.1 AFG Emulation method
Place the MAX/AFG emulation button on your button bar.![]()
Touching this button cycles through MAXC (Max compression), MAXT (Max Tension), MAXD (Dual Max) for VFG with corresponding descriptors for VTG Tornado.
With this option selected, when Print or TXD/AFG is selected, only the value specified is transmitted or printed.![]()
![]()
8.9.2 Live reading method
Selecting Print or TXD/AFG will transmit the value displayed in the main reading. If the main reading is changed to show either Maximum value, then that value will be transmitted or printed.
8.10 Select Operating Mode
The Vector instrument is set to Break Detect mode by default, but can be configured to one of three operating modes, and the operating mode determines what is shown in the sensor display panel:
- Break detect (Maximum Tension/clockwise, Live reading and Maximum Compression/anti-clockwise)
- Dual Peak (First Peak, Live Reading, Second Peak)
- Average over time (Maximum Tension/clockwise, Running Average - while the algorithm is active (see below) - and Maximum Compression/anti-clockwise)
To change the operating mode, Go to the Device settings page, select Sensor Settings and the Operating Mode.
8.10.1 Break Detect Mode
In this mode, the instrument will detect a break depending on three parameters:
- When the applied load exceeds a threshold value, then ...
- drops by a percentage of applied load, and...
- within a certain time.
![]() Low break threshold: can be any value between 1% and 25% of load cell capacity.
Low break threshold: can be any value between 1% and 25% of load cell capacity.
![]() % drop required to detect a break. Any value between 5% and 95% of applied force
% drop required to detect a break. Any value between 5% and 95% of applied force
![]() Time window within which break will be detected. Any value between 0 and 5 seconds.
Time window within which break will be detected. Any value between 0 and 5 seconds.
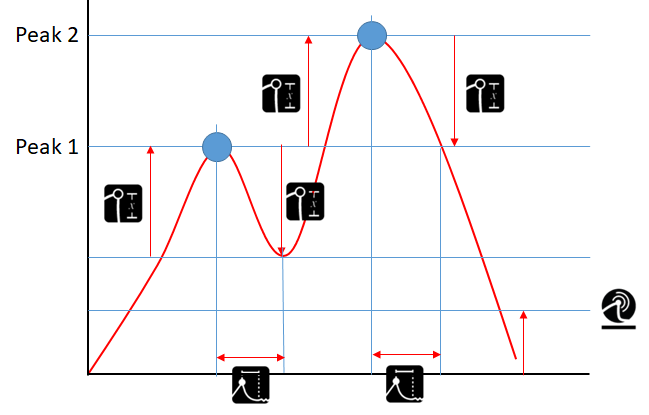
8.10.2 Dual Peak Mode
In dual peak mode, the break detect parameters are used to detect peaks rather than break where the % drop and time window are used to define a peak where the load drops by the given value on either side of a maximum within the time window defined. The same range constraints apply for the algithm parameters as for break mode.
Selecting this mode automatically configured the main sensor values display to show:
- TOP: 1st peak
- MIDDLE: Live reading
- BOTTOM: 2nd peak
8.10.3 Average Over Time Mode (v1.0.7.0 and later)
Selecting this mode automatically configures the main sensor display values to show:
- TOP: Max Tension
- MIDDLE: Running average during measurement
- BOTTOM: Max Compression
In this mode the instrument uses four parameters to determine how the function operates. All four parameters are found under Sensor settings when Average over Time Mode is selected.:
 Start Force Threshold: This value is used as the threshold value to start averaging.
 Stop Force Threshold: This value is used to determine when averaging should stop when no duration timer is set, or to stop averaging before the elapsed time is reached.
 Start delay time (s): Configured in Sensor Settings.
- Once the minimum threshold has been exceeded, the start delay timer is started.
- Once the start delay time has elapsed, averaging begins.
 Duration(s): Configured in Sensor Settings. Once averaging has started, the duration timer begins and once the duration has elapsed averaging stops. See example below for what happens if the timers are set to zero:
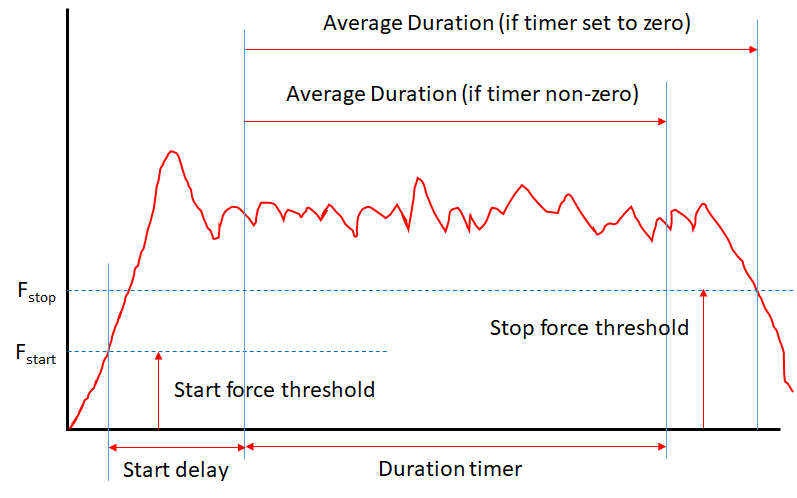
8.10.3.1 Setting the timers to 0
Setting either of the timers to 0 seconds disables them. If the start delay is 0, averaging starts immediately after the threshold is exceeded. If the duration is set to 0, averaging continues until the load value drops below the threshold.
8.10.3.2 Main Display
The main display will show the Av/T icon to show that the mode is selected.
During averaging a second timer is displayed to show elapsed time.
While the averaging is active, the main display value shows the running average, not the live load. Once the averaging time has elapsed or once the load drops below the threshold, the resulting average is shown.
8.11 Apply a multiplication factor
Under the Sensor Settings page, you can specify a multiplication factor ![]() that will then be applied to the live reading.
that will then be applied to the live reading.
If a factor is specified within the sensor settings page, then the live display reading and associated peaks, maxima, minima, etc will be multiplied by that factor.
Any number between 0.1 and 10 may be specified.
When a multiplication factor other than 1.000 is set, the units of measurement will be overlaid with an "X" symbol showing that the reading is modified.
8.12 Perform Tests when used with a MultiTest-dV or Vortex-dV
With previous Mecmesin instruments (AFG/AFTI), there were limited test controls that were available from the instrument when connected to a compatible MultiTest or Vortex test stand. These would command the test stand to stop, reverse, cycle, etc., as appropriate.
When using a Vector Instrument (VFG/VFTI), all controlled testing with the gauge / test stand system is now delegated to the test stand, and all test parameters are set from its front panel.
8.13 Adjustment and calibration
Calibration adjustment of a Vector Instrument is accessed via the sensor toolbar menu. It is protected from unauthorised use.
Adjustment and calibration can only be performed by an authorised representative of Mecmesin/PPT Group. Please contact Mecmesin to become an authorised representative for calibration.
Calibration can be performed by applying the desired force to the instrument and recording the live reading, useful for checks between calibration periods. The instrument 'calibration date' and 'calibration due date' can only be reset after calibration by an authorised representative of Mecmesin/PPT Group.
8.14 Set date and time
Enter the Device Settings menu either from the Information toolbar or by swiping across the main display (from left-to-right).
Select the Time/Date icon![]()
Enter your local standard time and activate the Daylight Savings toggle if required.
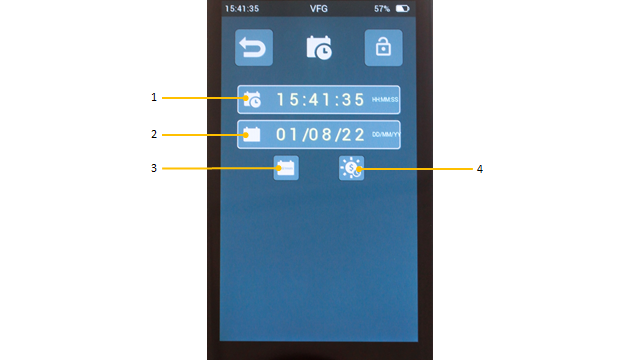
| 1 | Current Time |
|---|---|
| 2 | Current date |
| 3 | Calendar format toggle (switches between dd/mm/yy to mm/dd/yy) |
| 4 | Daylight Savings toggle (switches between ±1hr) |
8.15 Configure the Main Functions Bar
The right-hand three buttons can be configured to show icons of your choice.
Either swipe right from the Main display or touch the Device Settings icon from the information toolbar.
Select Display settings:![]()
Select the buttons of your choice for the three available buttons:![]()
![]()
![]()
8.16 Make and record a measurement
You can record/save tests measurements using the Record icon ![]()
The Record icon is found in the Graph toolbar or you can configure one of the four function/shortcut icons to include the Record icon.
To return to the live graph, activate the secondary display toolbar and select the “last test/live view” toggle icon.
8.17 Recall the last recorded test/measurement
To recall the last saved test, activate the microSD card toolbar and select the “last test/live view” toggle icon:![]()
8.18 Recall all stored (microSD card) tests/measurements
To select any previously recorded test, activate the microSD card toolbar and select the folder icon:![]()
Use the arrow keys to select the test to review.
8.19 Export Data
Every test is stored on the microSD card in two formats: Raw and .csv. Raw format is unique to the Vector Instrument. The .csv file holds the test data in a format that is able to be opened directly by Microsoft Excel (R) . The file name includes the date and time.
When the file is opened in Excel there is a header that accompanies the data with the following information:
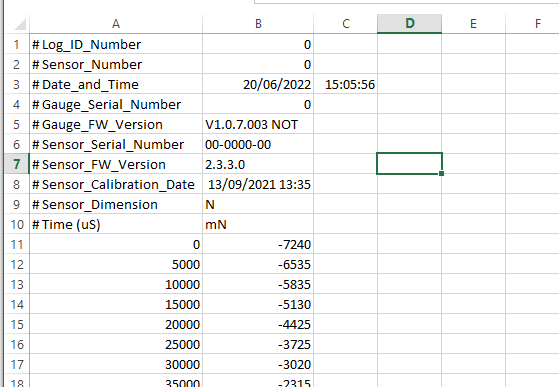
- Log_ID_Number and Sensor_Number are internal system parameters
- Date_and_Time is the date and time, according to the Instrument, when the data was collected.
- Gauge_Serial_Number is the serial number allocated by Mecmesin before shipping. This can be found on the back of the Vector Instrument.
- Gauge_FW_Version version is the firmware used at the time of collecting the data
- Sensor_Serial_Number and Sensor_FW_Version numbers are those that belong to the sensor in use at the time of collecting the data
- Sensor_Calibration_Date shows the date and time of the last official calibration
- Sensor_Dimension is the units of measurement as configured when the data was collected
Column headers are time in microseconds and system units of millinewtons. These are not configurable.
8.20 Perform a series of measurements to obtain a statistical set
This will show a red dot in the statistics display and wait for a measurement.
A measurement value can only be stored when the measurement is considered 'complete'. This is defined when the force drops from a peak by a given percentage (by using the break detect settings - configured in the Sensor settings). Each time this happens a result is recorded in the data table.
As soon as more than two results have been collected, summary statistics are displayed on the right-hand side of the table and updated with each result until the set is complete.
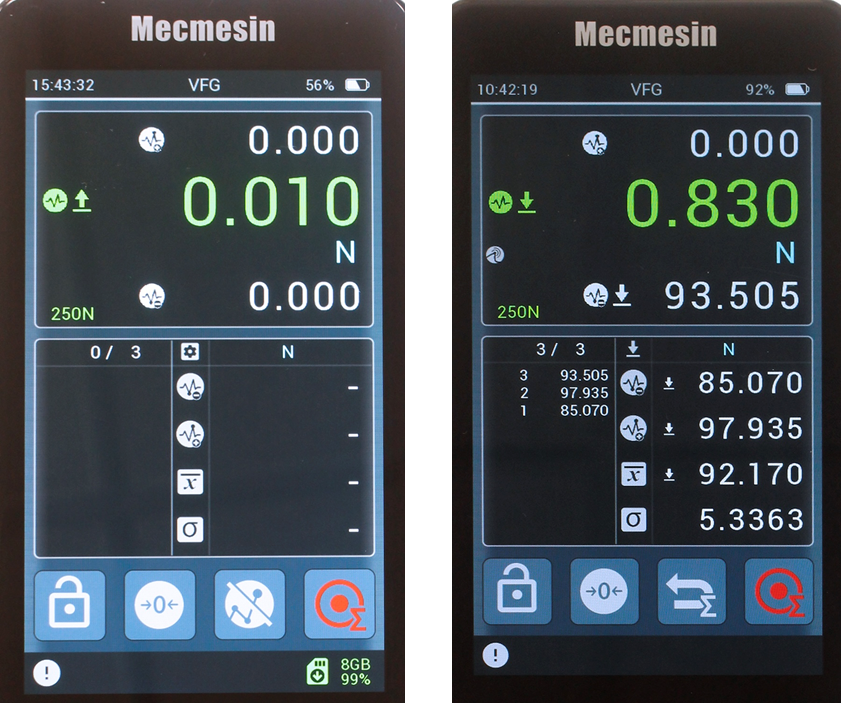
Before and after collecting readings for a statistical set.
8.21 Using your VFG as a Shotcrete Penetrometer
If you purchased your VFG as part of the Shotcrete Penetrometer product bundle then the VFG will have been pre-configured from the factory to the settings below.
Otherwise, the VFG can be configured to collect statistics in the units of Shotcrete Penetrometry as defined in test standard EN14488-2. To do so requires the use of specific probe attachments - for example, Mecmesin part #432-519 (pictured below):
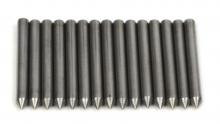
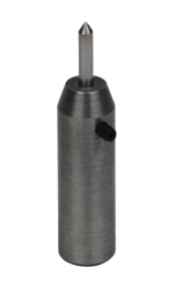
The following steps provide the optimum configuration for shotcrete penetrometry.
8.21.1 Units settings
Newtons - If DaN (DekaNewtons) are required, then set the X factor in the Sensor settings to 0.1.
8.21.2 Sensor settings
| |
|
|
|
|
|
|
30 N |
| 90% | |
| 0.5 s | |
| If DaN are required, set X-factor to 0.1 |
8.21.3 Statistics settings
The Penetrometer mode setting enables the instrument to automatically convert the statistical set of measured force data into the compressive strength value in MPa, based on the selected aggregate size.
| 10. EN14488-2 requires 10 readings. | |
| User choice (send results to printer upon completion). | |
|
User choice (auto-reset between readings). |
| User choice (send results to microSD card upon completion). | |
| ON (Penetrometer mode). | |
| User choice (aggregate size 8 (OFF), 16 (ON)). |
8.21.4 Penetrometer screens
When set to Penetrometer configuration, the following screen display and Main Button Bar setup is an efficient way to work.

| 1 |
Sensor display. First and second rows blank. |
|---|---|
| 2 | Third row. Maximum compression mode icons. |
| 3 | Third row. Maximum (peak) compression value. |
| 4 | Fourth row. Break detect OPERATION MODE. |
| 5 | Fourth row. Current units. |
| 6 | Statistical table. Displays aggregate size "MPa8" or "MPa16" depending on your choices in the Statistics settings. |
| 7 | Last X values entered into the statistical table of N total. 10/10 for a set of Penetrometer readings. This data is output from the print icon. |
| 8 | Dataset summary. Minimum, maximum, mean and standard deviation values. This data is output from the print icon. |
| 9 | Main button bar. Tare (zero) reading for next compression. |
| 10 | Main button bar. Statistics Record button. |
| 11 | Main button bar. Send Output to Printer button. |
| 12 |
Press the statistics display to show the Statistics toolbar to access other useful buttons. |
| 13 |
Statistics toolbar (including Statistics Record button added to main button bar). |
| 14 |
Delete last statistical value. Useful if the penetration needle hits a large aggregate particle or other body to render reading invalid. |
| 15 |
Delete statistical set. |
8.21.5 Taking Penetrometer readings
Use the device in the same way as for any other statistical set (batch), detailed in the previous section.
For the specific EN14488-2 test procedure calculations and data export, see the Shotcrete Penetrometer User Guide.
8.22 Inserting and removing a microSD card
8.22.0.1 Inserting
To insert a microSD card, push the card into the instrument microSD slot with the card's pins facing upwards.
If a microSD card has been partially ejected, but not yet fully removed, you need to fully remove the card before re-inserting it.
Push the microSD card all the way in until it clicks.
8.22.0.2 Removing
First, select the Eject microSD card icon ![]() from the microSD card toolbar.
from the microSD card toolbar.
To eject the microSD card, push the inserted microSD card in further until it clicks, then release. The microSD card will be ejected. Remove and store in a safe place, or back up the data to your PC.